Edmonton Real Estate Update

Monthly real estate market update for Edmonton with graphs and statistics.  Comments on value and performance on Edmonton's real estate market.

Found 82 blog entries about Edmonton Real Estate Update.

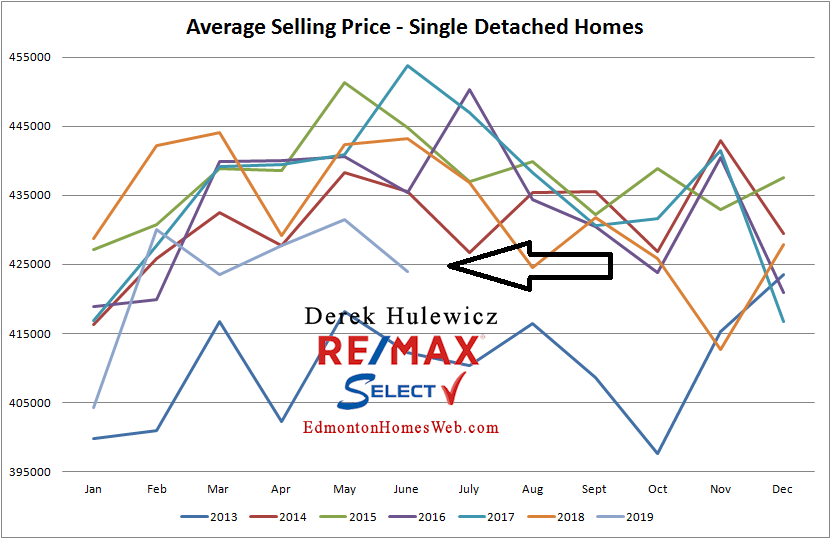
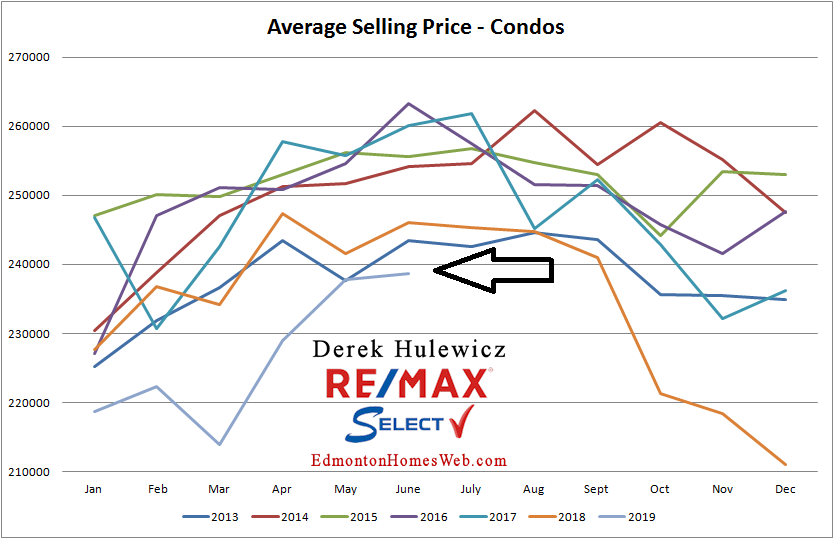
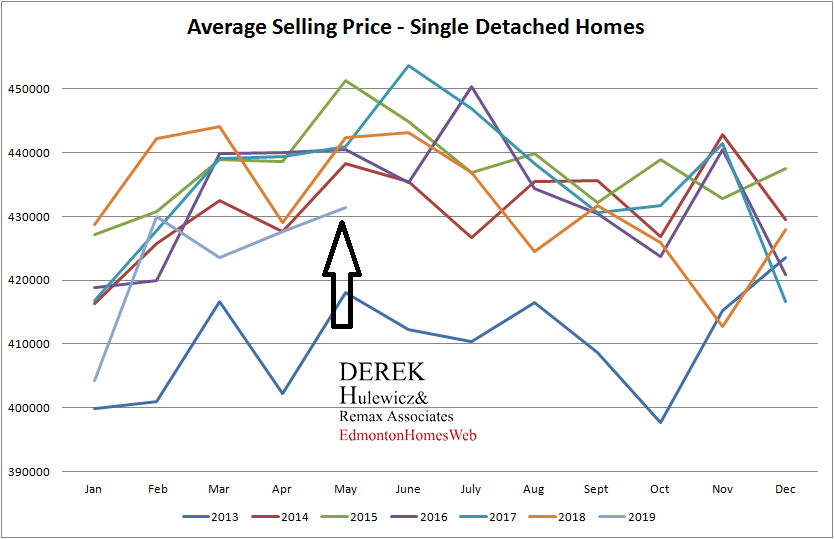
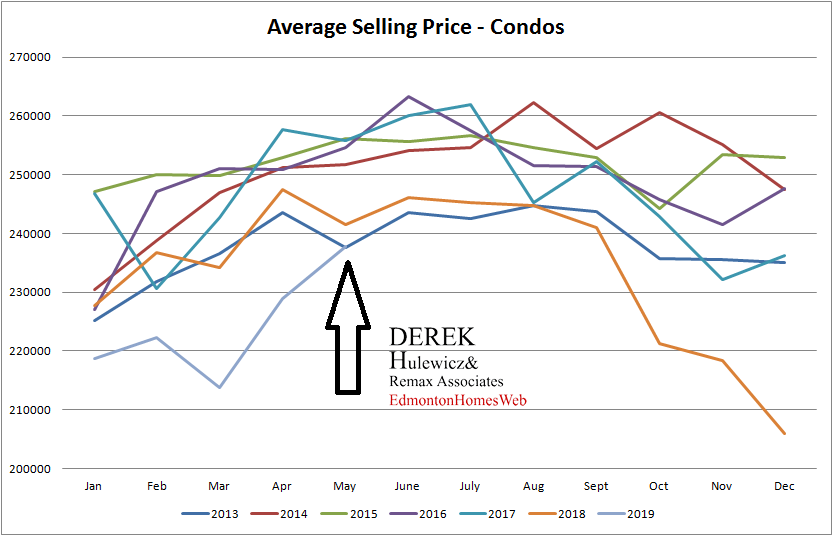
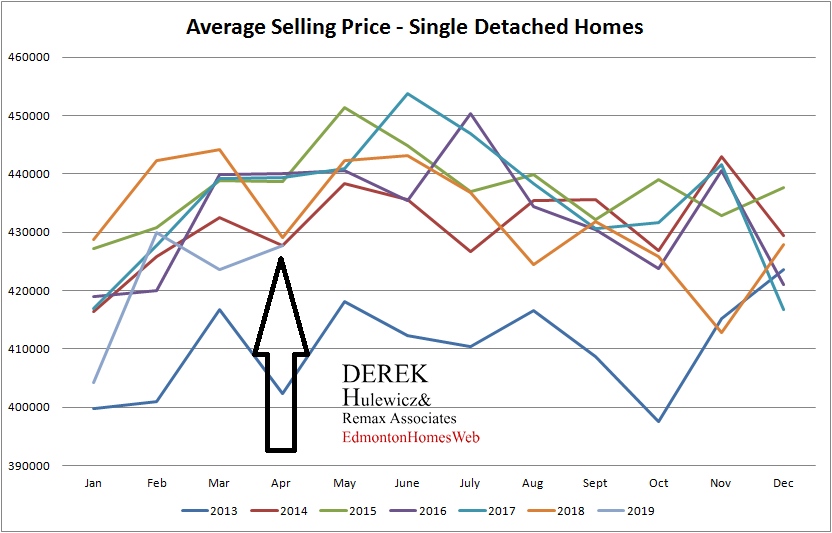
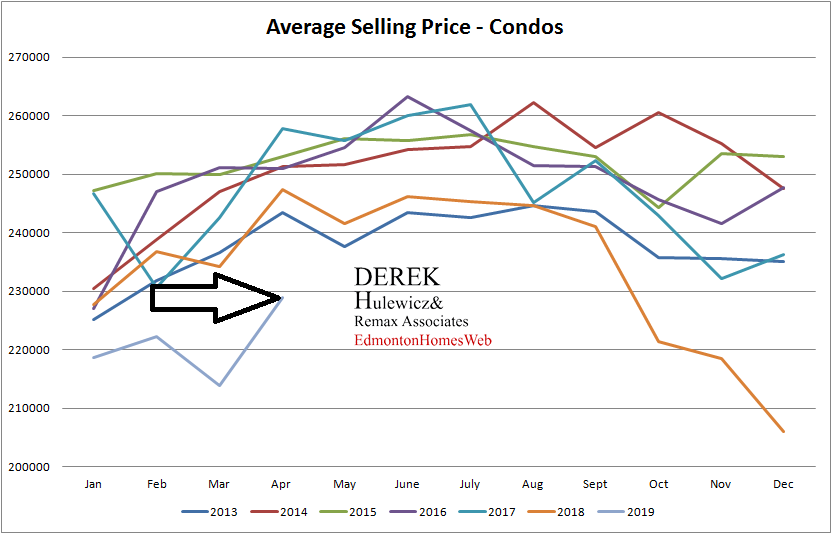
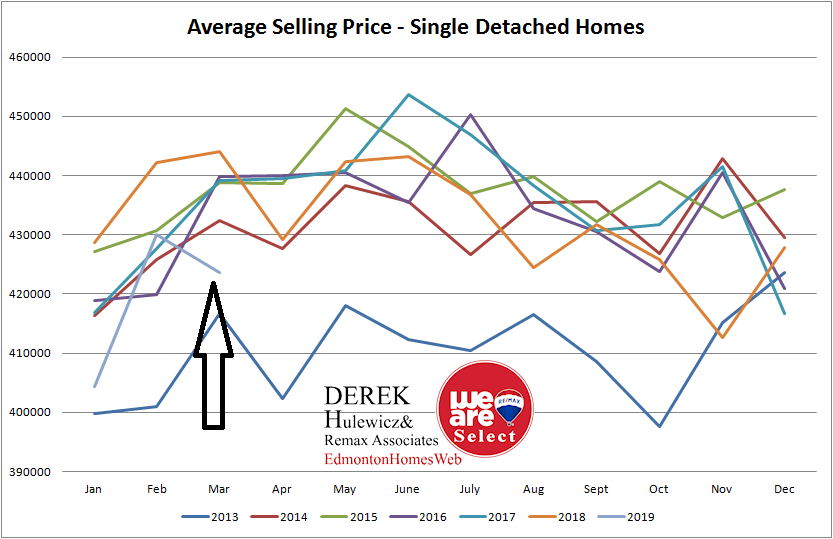
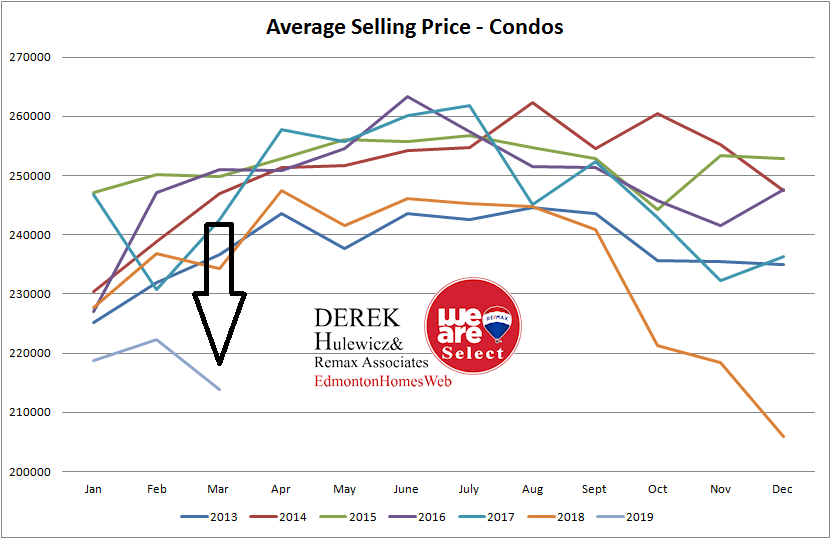
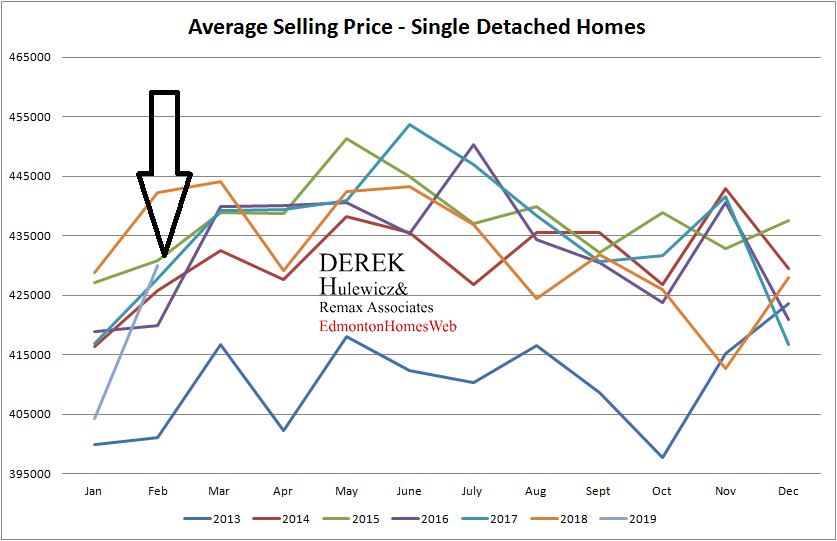
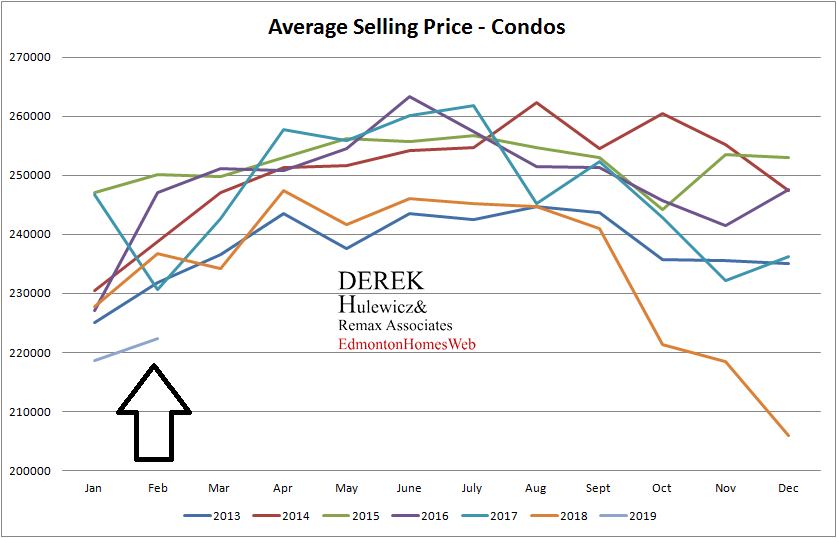
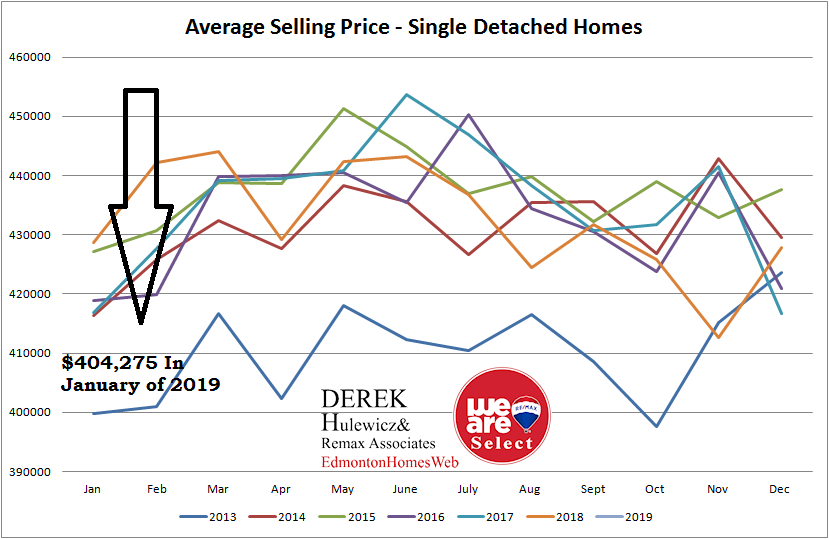
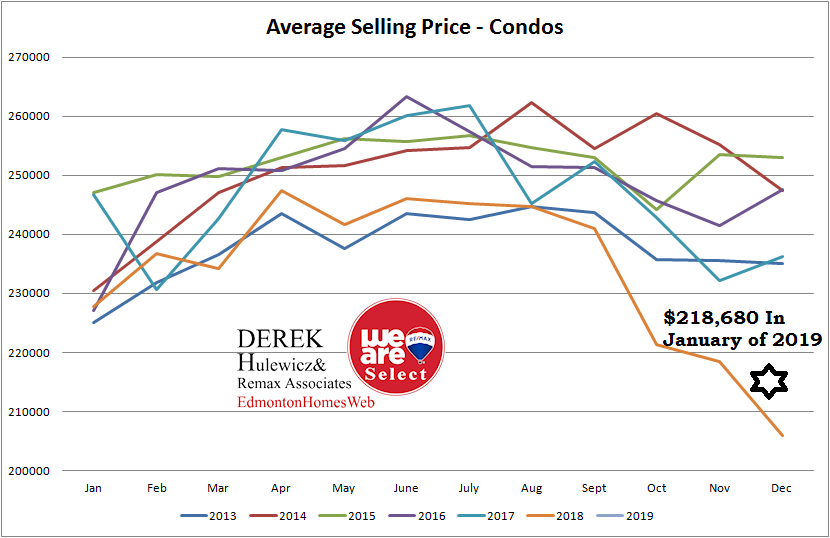
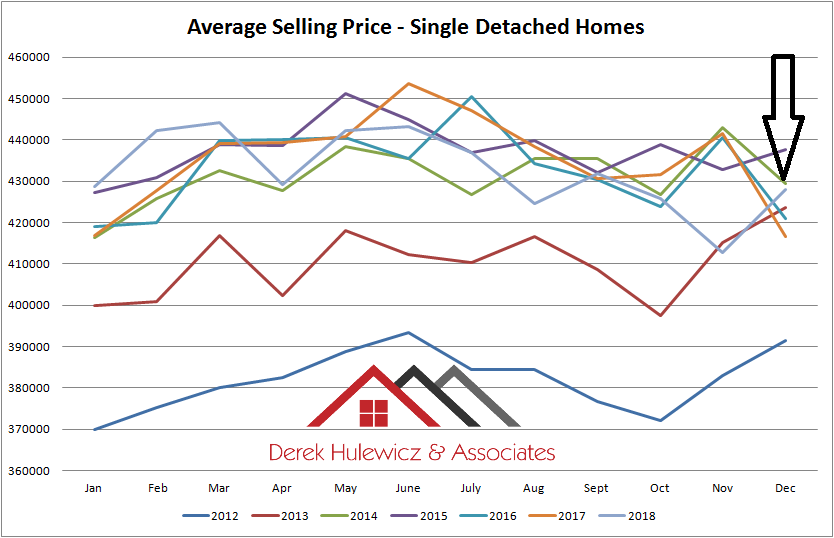
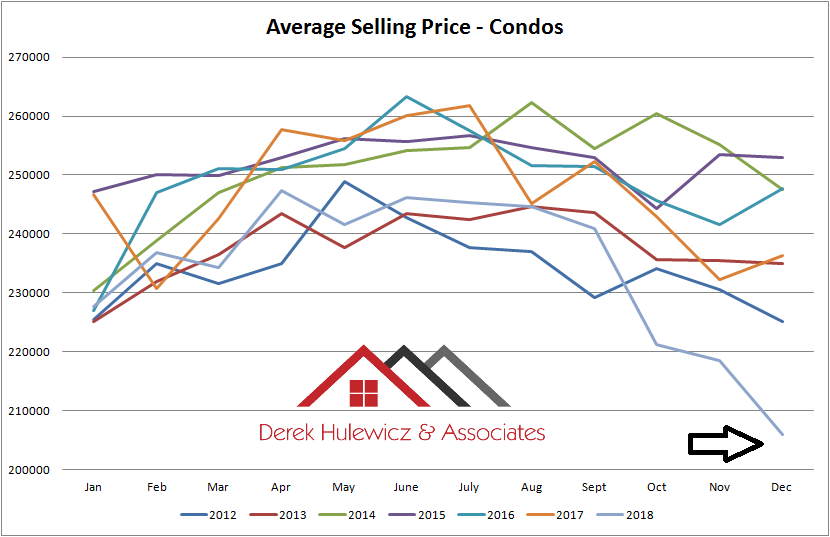
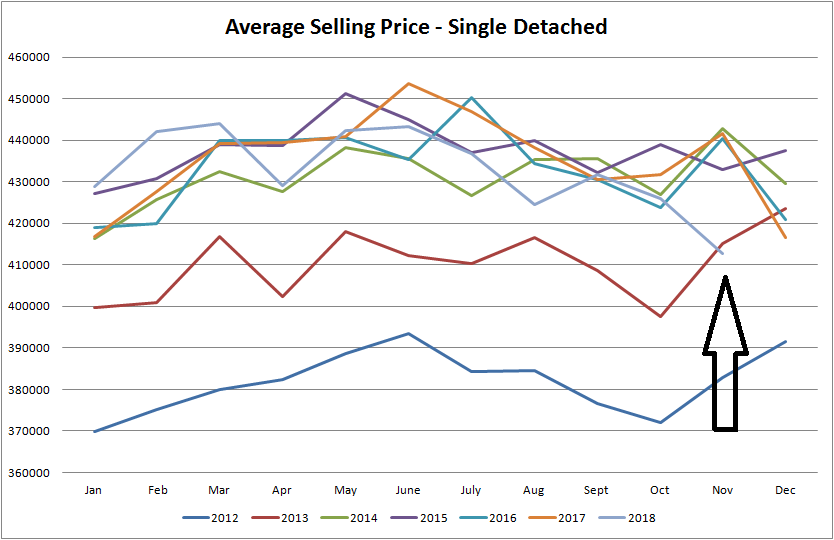
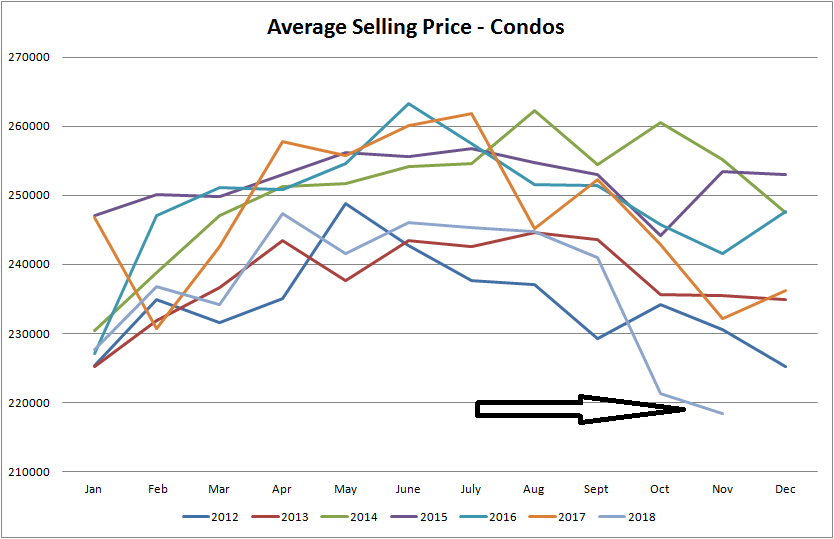
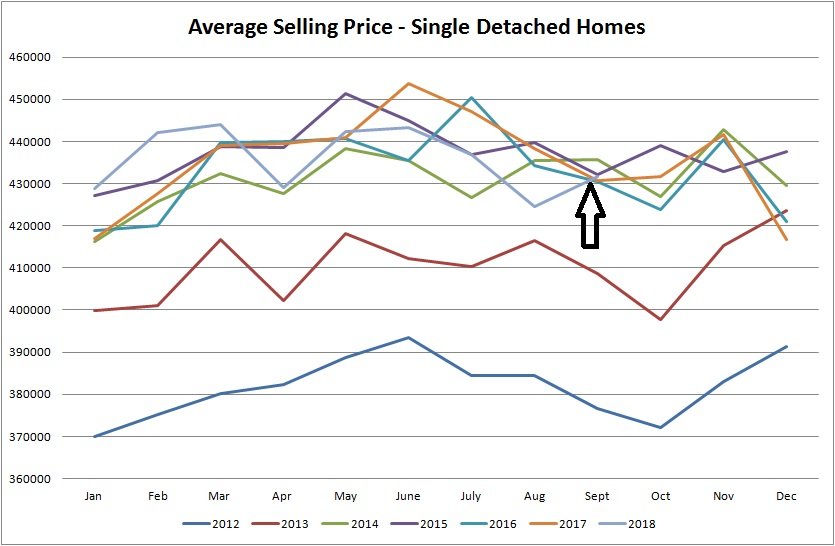
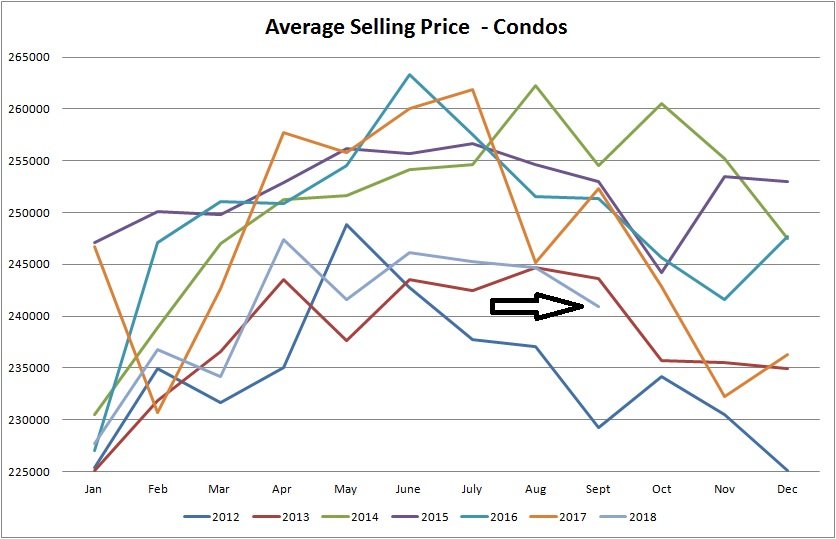
The average price for a single family detached home in June of 2019 was $423,894 down by 1.76% from last month and down by 4.45% from June of 2018.The condo prices were up slightly by 0.36% at $238,648 from $237,802 last month.

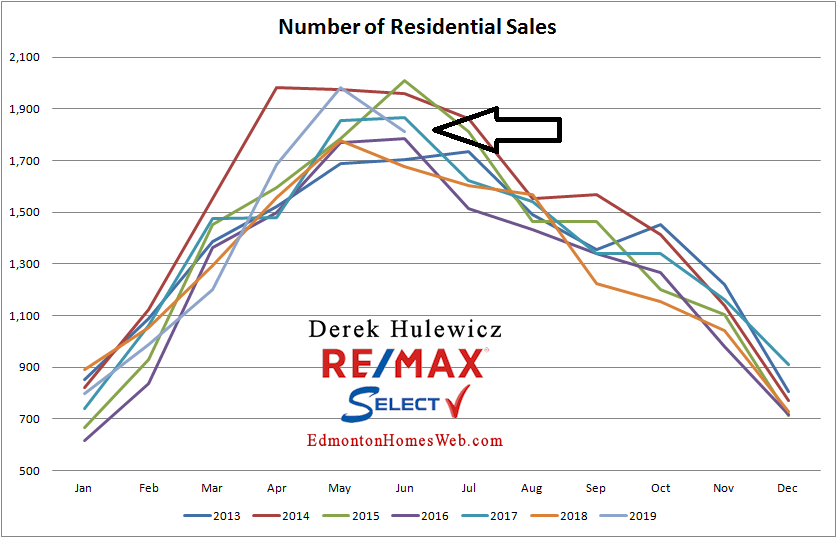
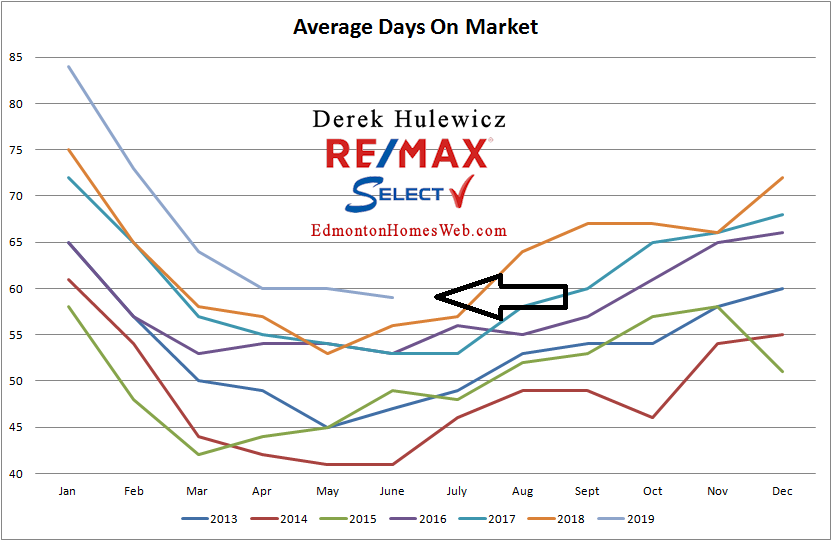
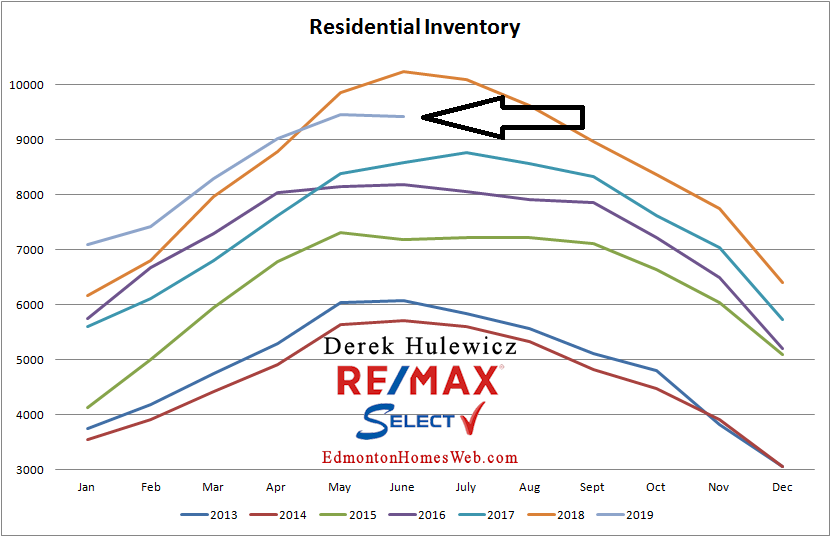
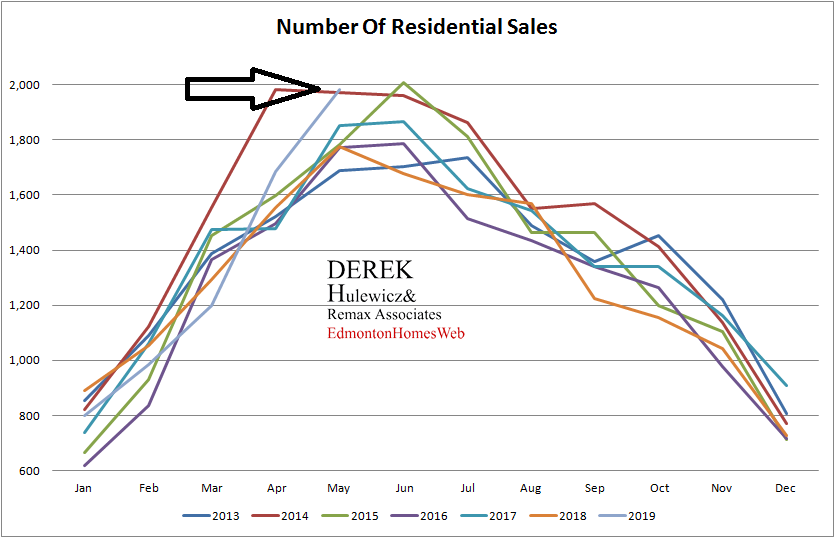
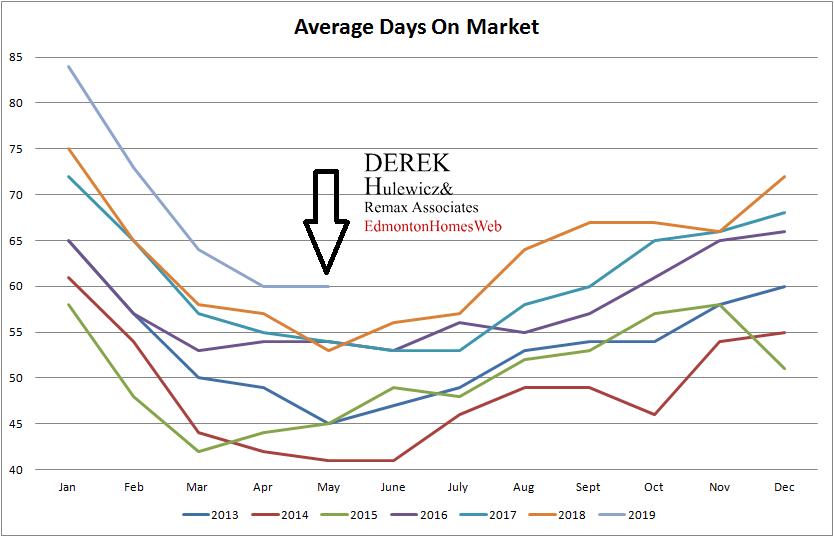
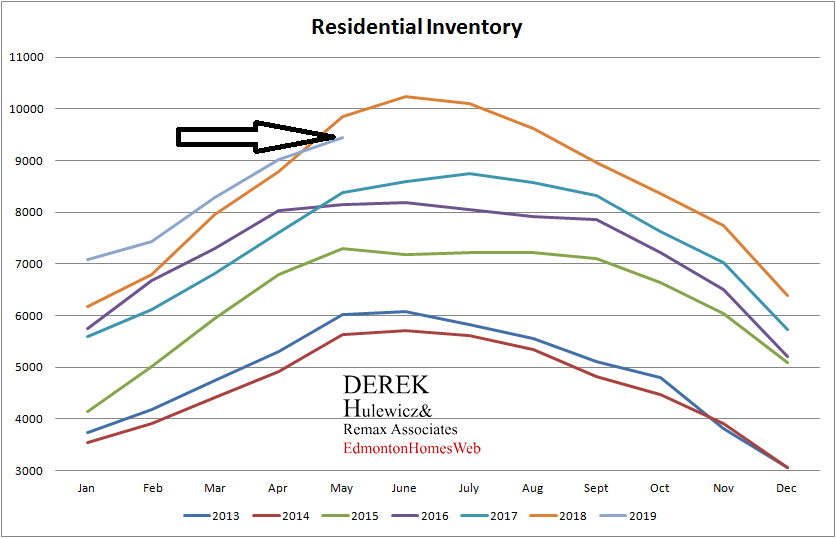
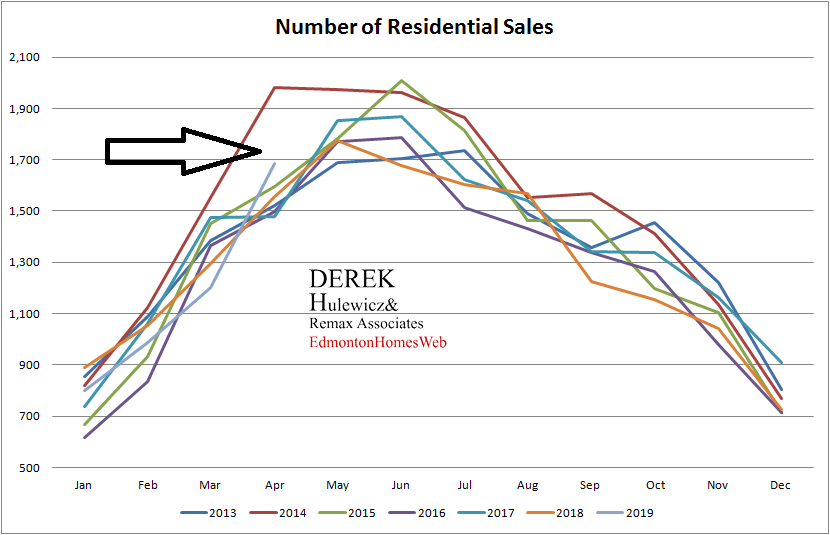
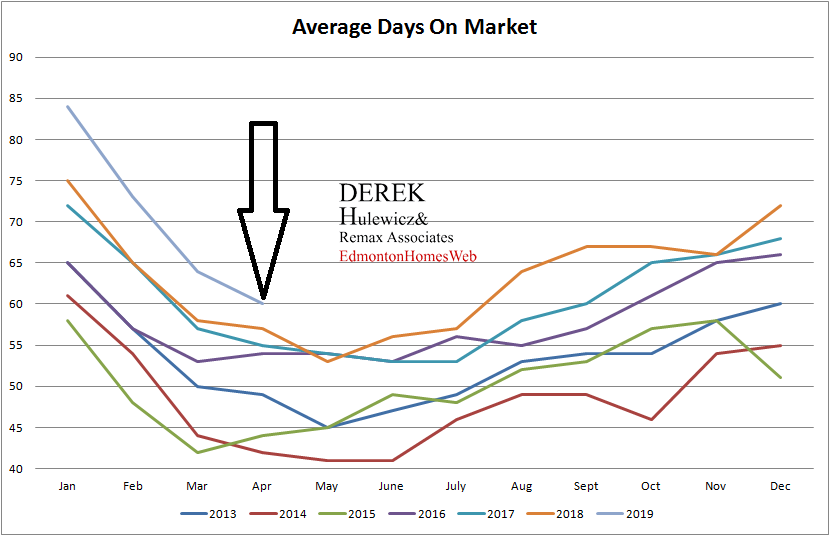
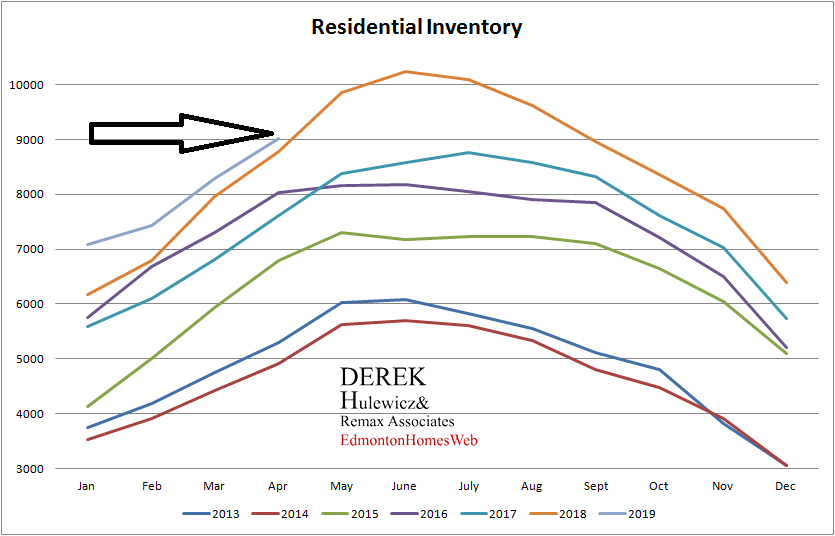
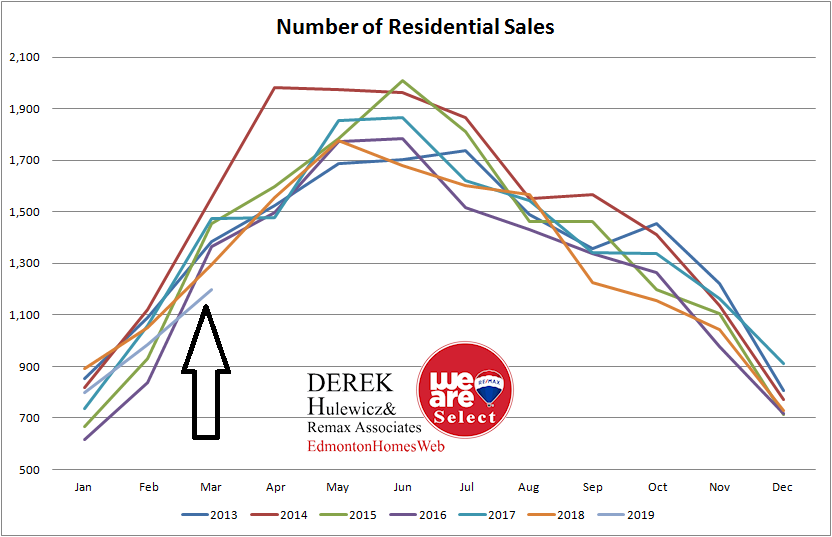
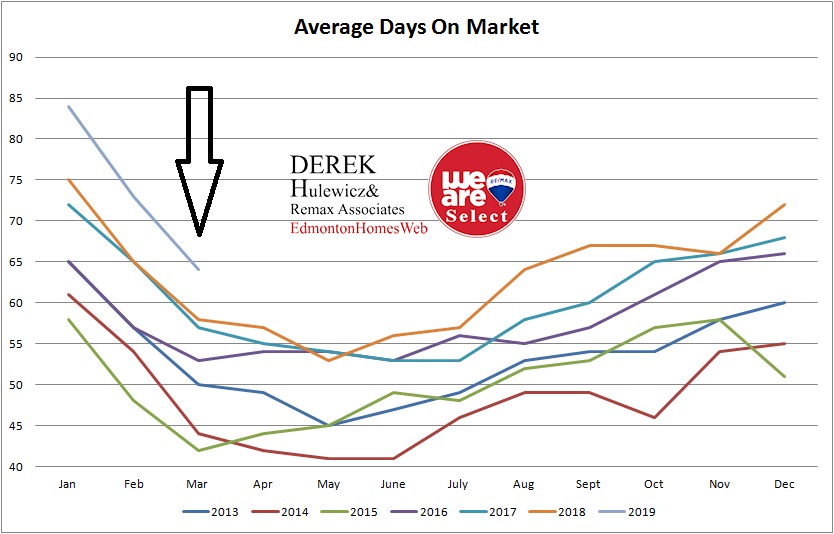
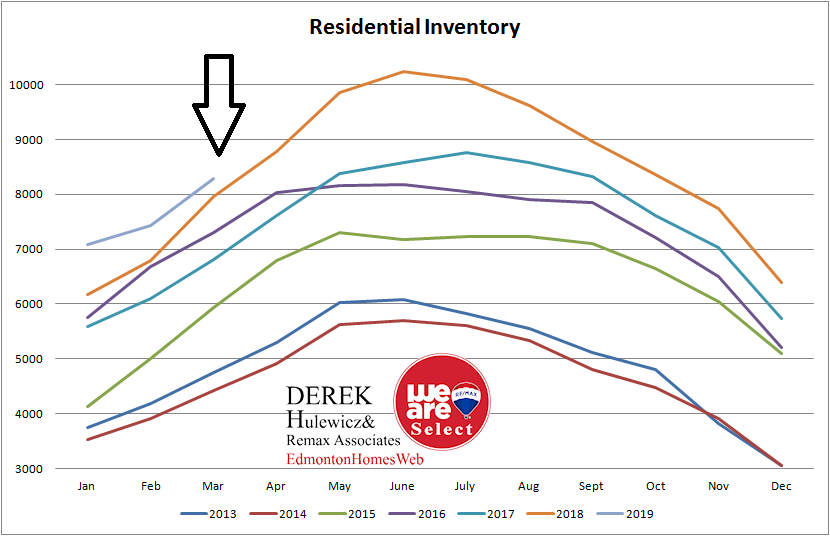
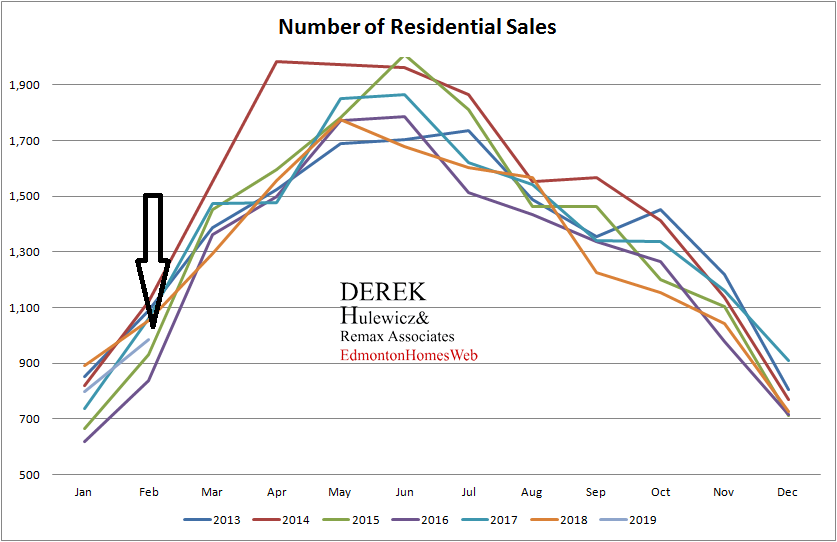
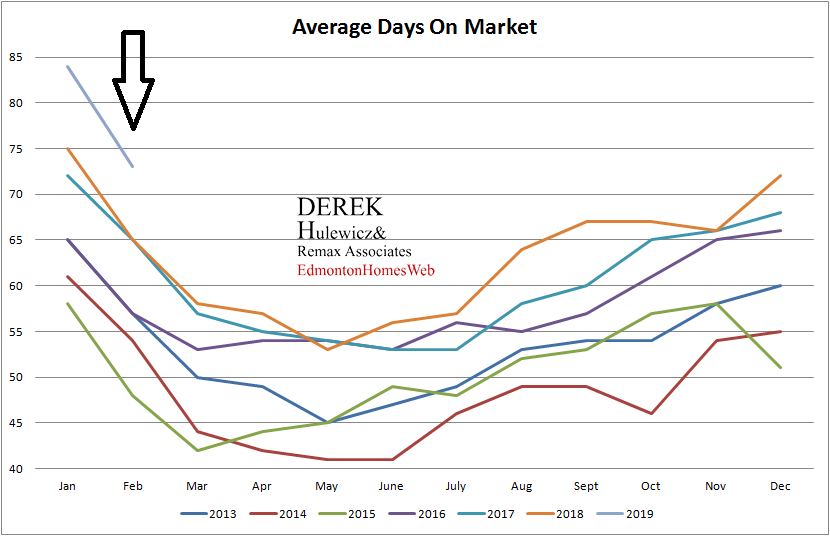
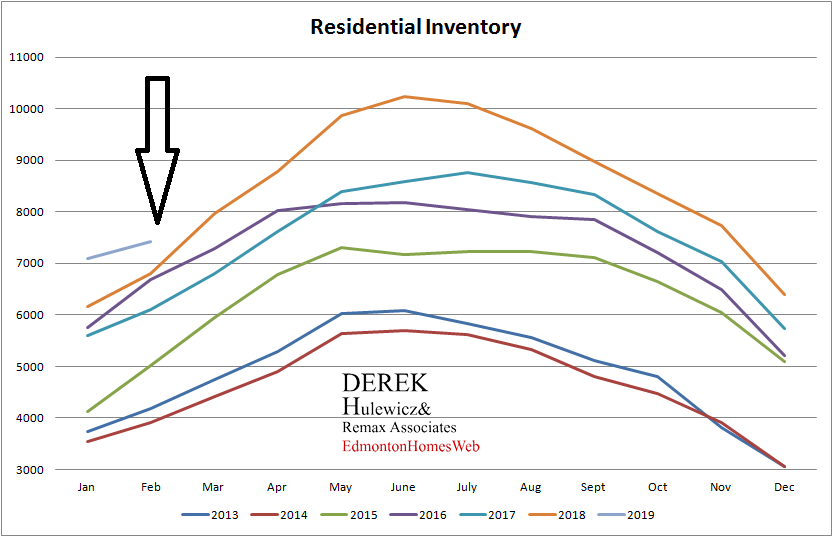
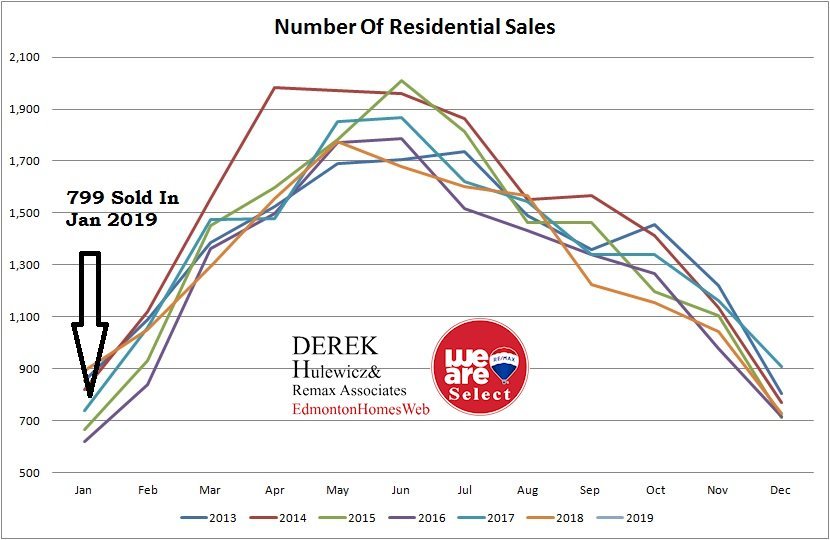
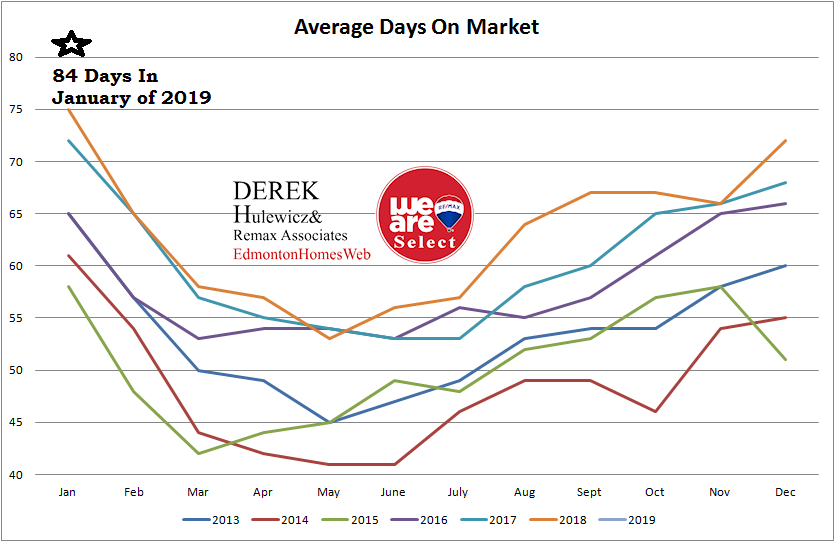
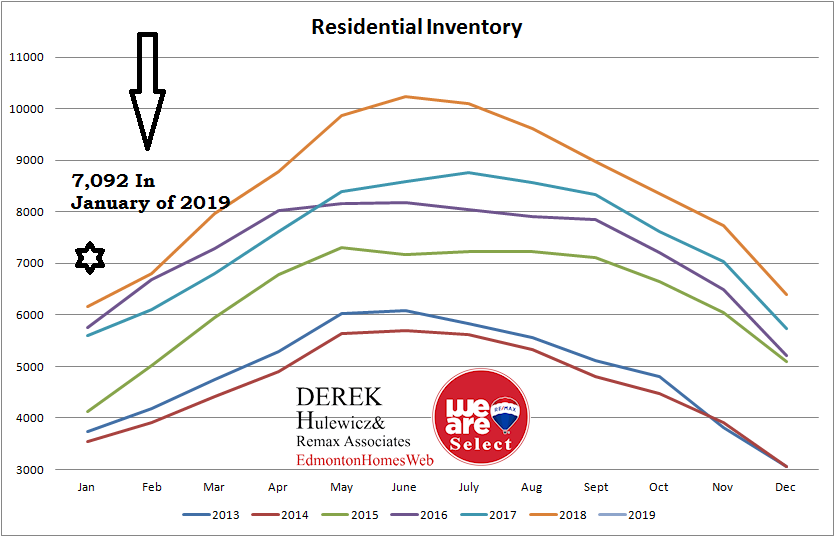
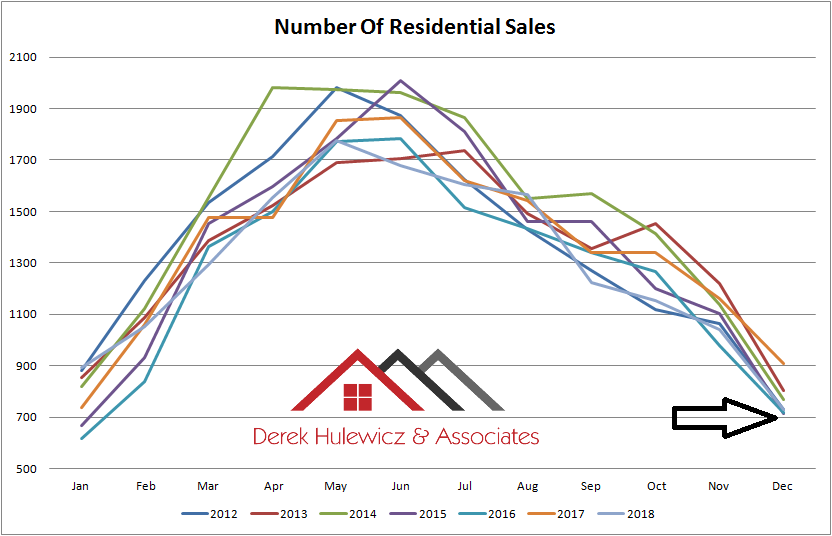
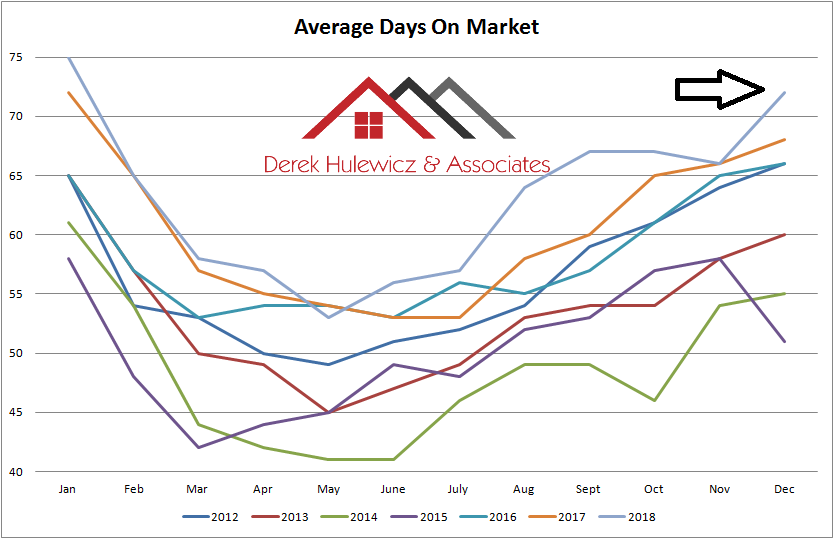
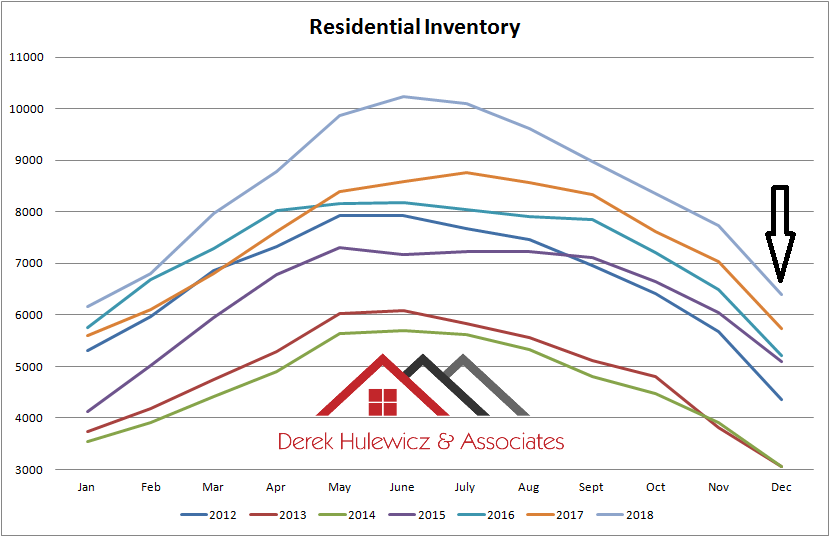
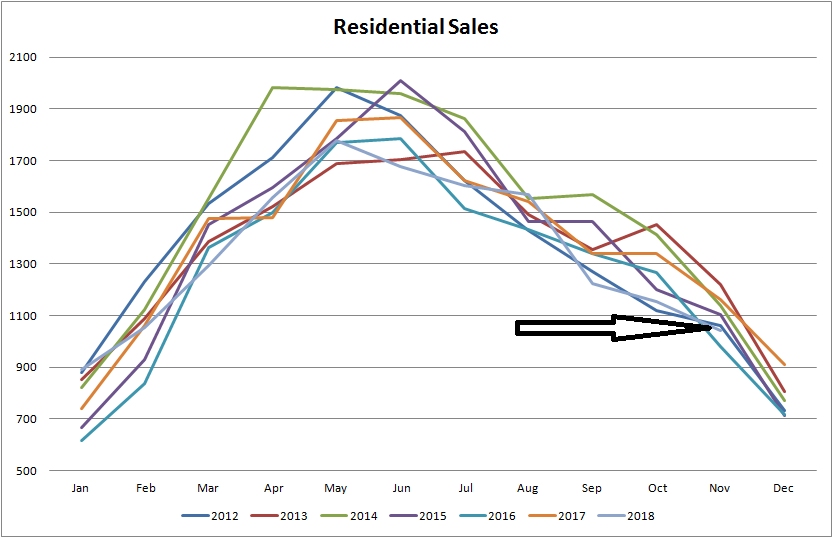
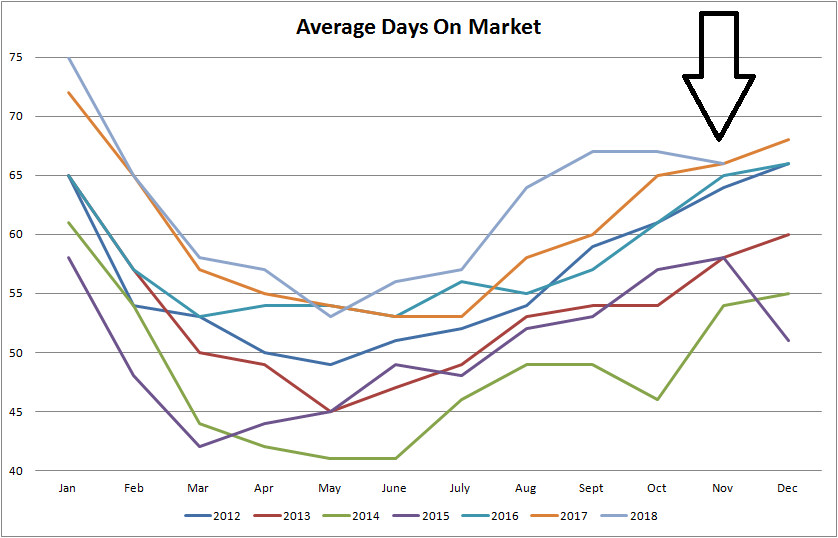
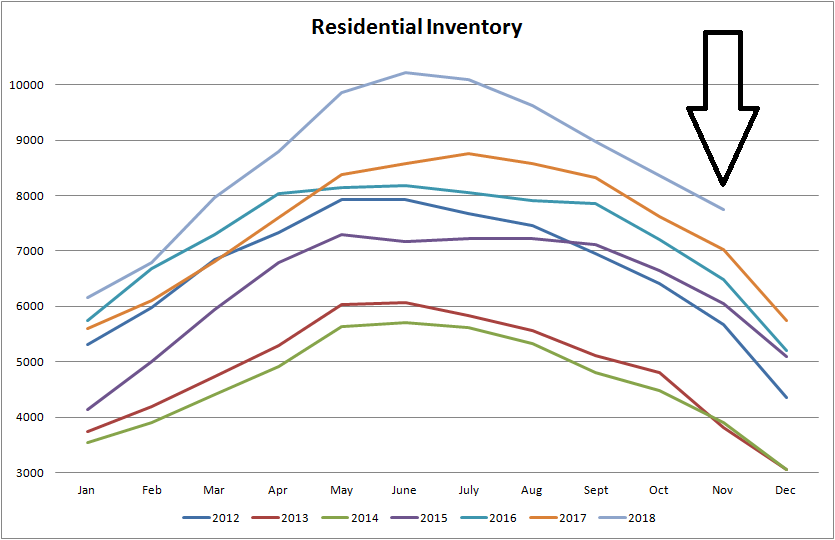
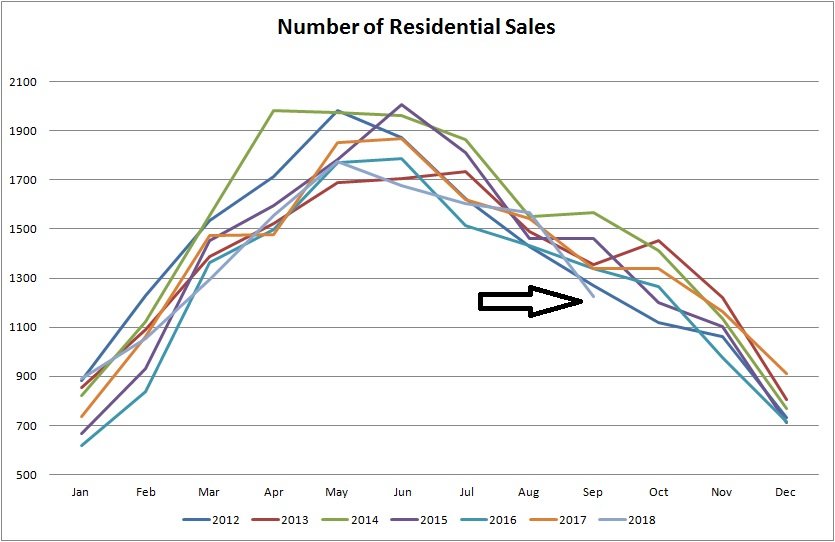
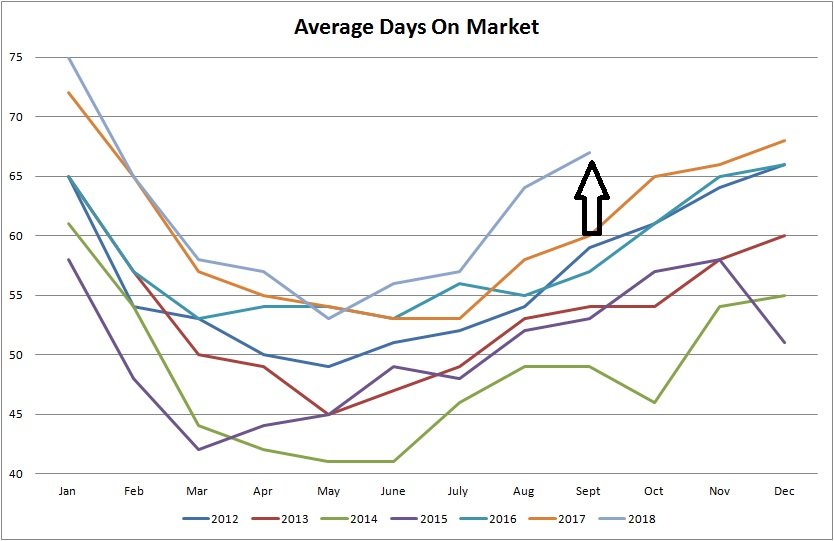
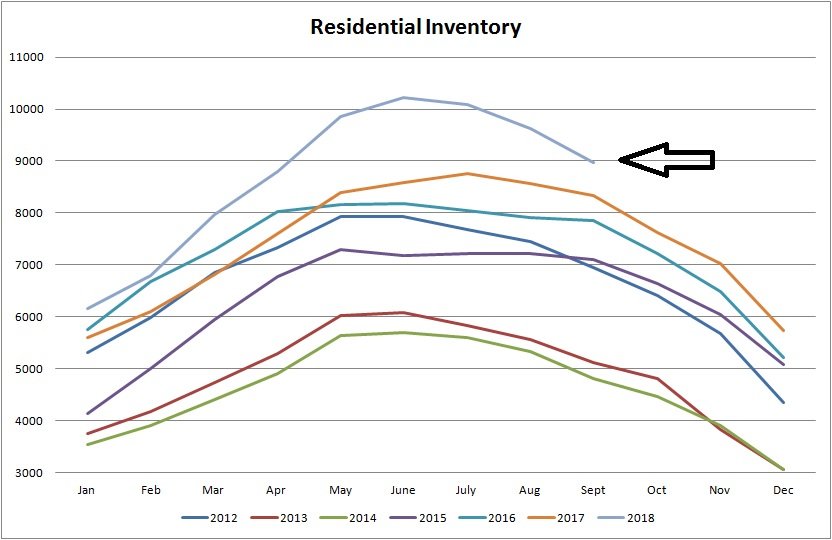
Total of 1,811 residential properties have sold in the 6th month of 2019, 8.58% less than in May and 0.56% more than in same period last year. The inventory decreased to 9,428 residential properties available compared to 9,451 last months and 10,230 in June of 2018. Average Days-On-Market were down by 1 day at 59.

All the information in this article has been provided by Realtors® Association of Edmonton!

real estate data for average selling price of homes sold in edmonton from january of 2012 to june of 2019

real estate data for average selling price of condos sold in edmonton from january of 2013 to june of 2019

real estate data for number of homes sold in edmonton from january of 2013 to june of 2019

real estate data for average days on the market for homes sold in edmonton from january of 2013 to june of 2019

real estate data for inventory of homes for sale in edmonton from january of 2013 to june of 2019

864 Views, 0 Comments

The average price for a single family detached home in May of 2019 was $431,484 up by 0.89% from last month and down by 2.62% from May of 2018.The condo prices were also up by 3.87% at $237,802 from $228,933 last month.

Total of 1,981 residential properties have sold in the 5th month of 2019, 17.64% more than in April and 4.04% more than in same period last year. The inventory increased to 9,451 residential properties available compared to 9,015 last months and 9,859 in May of 2018. Average Days-On-Market were unchanged at 60.

All the information in this article has been provided by Realtors® Association of Edmonton!

Edmonton real estate statistics for average selling prices of homes sold from January of 2013 to May of 2019

Edmonton real estate statistics for average selling prices of condos sold from January of 2013 to May of 2019

Edmonton real estate statistics for number of residential properties sold from January of 2013 to May of 2019

Edmonton real estate statistics for average days on market for properties for sale from January of 2013 to May of 2019

Edmonton real estate statistics for number of properties for sale from January of 2013 to May of 2019

1,065 Views, 1 Comment

The average price for a single family detached home in April of 2019 was $427,657 up by 1.17% from last month and down by 1.38% from April of 2018. The condo prices were also up by 7.05% at $228,933 from $213,856 last month.

Total of 1,684 residential properties have sold in the 4th month of 2019, 40.33% more than in March and 1.63% more than in same period last year. The inventory increased to 9,015 residential properties available compared to 8,287 last months and 8,788 in April of 2018. Average Days-On-Market were down from last month by 4 days at 60.

All the information in this article has been provided by Realtors® Association of Edmonton!

real estate statistics for average selling prices for homes sold in Edmonton from January of 2012 to April of 2019

real estate statistics for average selling prices for condominiums sold in Edmonton from January of 2012 to April of 2019

real estate statistics for average number of properties sold in Edmonton from January of 2012 to April of 2019

real estate statistics for average days on market of homes sold in edmonton from January of 2012 to April of 2019

real estate statistics for residential inventory of homes for sale in Edmonton from January of 2012 to April of 2019

915 Views, 1 Comment

The average price for a single family detached home in March of 2019 was $423,571 down by 1.5% from last month and down by 5.02% from March of 2018. The condo prices were also down by 3.78% at $213, 856 from $222,267 last month.

Total of 1,200 residential properties have sold in the 3rd month of 2019, 21.70% more than in February and 13.04% less than in same period last year. The inventory increased to 8,287 residential properties available compared to 7,422 last months and 7,963 in March of 2018. Average Days-On-Market were down by 9 days at 64.

All the information in this article has been provided by Realtors® Association of Edmonton!

real estate graph for all the statistic for average selling prices of homes sold in Edmonton from January of 2013 to March of 2019

real estate graph for all the statistic for average selling prices of condos sold in Edmonton from January of 2013 to March of 2019

real estate graph for all the statistic for number of residential properties sold in Edmonton from January of 2013 to March of 2019

real estate graph for all the statistic for average days on market for homes sold in Edmonton from January of 2013 to March of 2019

real estate graph for all the statistic for inventory of homes for sale in Edmonton from January of 2013 to March of 2019

2,000 Views, 0 Comments

Despite slower start to the year, the average price for a single family detached home in Feburary of 2019 was $430,000 up by 6.36% from last month and down by 1.32% from February of 2018. The condo prices were also up by 4.16% at $222,267 from $218,680 last month.

Total of 986 residential properties have sold in the 2nd month of 2019, 23.4% more than in January and 11% less than in same period last year. The inventory increased to 7,422 residential properties available compared to 7,092 last months and 6,797 in February of 2018. Average Days-On-Market were down by 9 days at 73.

All the information in this article has been provided by Realtors® Association of Edmonton!

real estate graph for all the statistics of average selling price of homes sold in Edmonton from January of 2013 to February of 2019

real estate graph for all the statistics of average selling price of condos sold in Edmonton from January of 2013 to February of 2019

real estate graph for all the statistics of number of residential sales of properties sold in Edmonton from January of 2013 to February of 2019

real estate graph for all the statistics for average days on market of homes sold in Edmonton from January of 2013 to February of 2019

real estate graph for all the statistics for number of properties for sale in Edmonton from January of 2013 to February of 2019


758 Views, 0 Comments

The average price for a single family detached home in January of 2019 was $404,275 down by 5.52% from last month and down by 6.04% from January of 2018. The condo prices were up by 6.18% at $218,680 from $205,947 last month.

Total of 799 residential properties have sold in the first month of 2019, 9.75% more than in December and 15.00% less than in same period last year. The inventory increased to 7,092 residential properties available compared to 6,394 last months and 6,165 in January of 2018. Average Days-On-Market were up by 10 days at 84.

All the information in this article has been provided by Realtors® Association of Edmonton!

real estate graph for all the statistics of homes sold in Edmonton from January of 2013 to January of 2019

real estate graph for all the statistics of condos sold in Edmonton from January of 2013 to January of 2019

real estate graph for all the statistics of number of properties sold in Edmonton from January of 2013 to January of 2019

real estate graph for all the statistics of average days on market of homes sold in Edmonton from January of 2013 to January of 2019

real estate graph for all the statistics of inventory of homes for sale in Edmonton from January of 2013 to January of 2019


1,220 Views, 1 Comment

The average price for a single family detached home in December of 2018 was $427,892 up by 1.46% from last month and up by 2.68% from December of 2017. The condo prices were down by 5.72% at $205,947 from $218,443 last month.

Total of 728 residential properties have sold in the 12th month of 2018, 30.13% less than in November and 19.65% less than in same period last year. The inventory decreased to 6,394 residential properties available compared to 7,741 last months and 5,736 in December of 2017. Average Days-On-Market were up by 6 days at 72.

All the information in this article has been provided by Realtors® Association of Edmonton!

real estate graph for average selling price for single detached homes sold in edmonton from january of 2012 to december of 2018

real estate graph for average selling price for condos sold in edmonton from january of 2012 to december of 2018

real estate graph for number of residential properties sold in edmonton from january of 2012 to december of 2018

real estate graph for average days on market of homes sold in edmonton from january of 2012 to december of 2018

real estate graph for residential inventory of homes for sale in edmonton from january of 2012 to december of 2018

real estate graph for all the statistcs of homes for sale in edmonton from january of 2012 to december of 2018

744 Views, 0 Comments

The average price for a single family detached home in November of 2018 was $421,715 down by 0.97% from last month and down by 4.55% from November of 2017. The condo prices were also down by 1.29% at $218,443 from $2221,293 last month.

Total of 1,042 residential properties have sold in the 11th month of 2018, 9.78% less than in November and 10.56% less than in same period last year. The inventory decreased to 7,741 residential properties available compared to 8,363 last months and 7,030 in November of 2017. Average Days-On-Market were down by one day at 66.

All the information in this article has been provided by Realtors® Association of Edmonton!

real estate stats for average selling price of homes in edmonton from january of 2012 to november of 2018

real estate stats for average selling price of condos in edmonton from january of 2012 to november of 2018

rreal estate stats for number of homes sold in edmonton from january of 2012 to november of 2018

real estate stats for average days on market  of homes sold in edmonton from january of 2012 to november of 2018

real estate stats for residential inventory for homes for sale  in edmonton from january of 2012 to november of 2018

real estate stareal estate stats for edmonton from january of 2017 to november of 2018


1,484 Views, 0 Comments

Well, it looks like the rising inventory and lower number of sales have pushed the prices of homes and condos down in October. As sellers compete to have their properties sold in a reasonable time, the buyers are definitely in advantage position this year with more properties to choose from. Are we seeing a beginning of a decline in residential markets in Greater Edmonton Area? While TSX Composite index is down and hovering around 15,100 today compared to 16,100 a year ago, US economy is doing better than many predicted. I am an optimist and with all things considered, I think we may see a small correction or possibly flat market in the next few months to come.

The average price for a single family detached home in October of 2018 was $425,864 down by

14,252 Views, 0 Comments

The average price for a single family detached home in September of 2018 was $431,745 up by 1.71% from last month and up by 0.25% from August of 2017. The condo prices were down slightly by 1.53% at 240,953 from $244,701 last month.

Total of 1,225 residential properties have sold in the 9th month of 2018, 21.83% less than in August and 8.24% more than in same period last year. The inventory decreased to 8,969 residential properties available compared to 9.618 last months and 8,331 in September of 2017. Average Days-On-Market were up by 3 days at 67.

All the information in this article has been provided by Realtors® Association of Edmonton!

real estate statistics graph for average selling price of houses sold in edmonton from january of 2012 to september of 2018

real estate statistics graph for average selling price of condos sold in edmonton from january of 2012 to september of 2018

real estate statistics graph for number of real estate in edmonton from january of 2012 to september of 2018

real estate statistics graph for average sellreal estate stats graph fo average days on market for homes sold in edmonton from january of 2012 to september of 2018

inventory graph for residential real estate  for sale in edmonton from january of 2012 to september of 2018


946 Views, 0 Comments

Sign up for email updates