Edmonton Real Estate Update

Monthly real estate market update for Edmonton with graphs and statistics.  Comments on value and performance on Edmonton's real estate market.

Found 82 blog entries about Edmonton Real Estate Update.

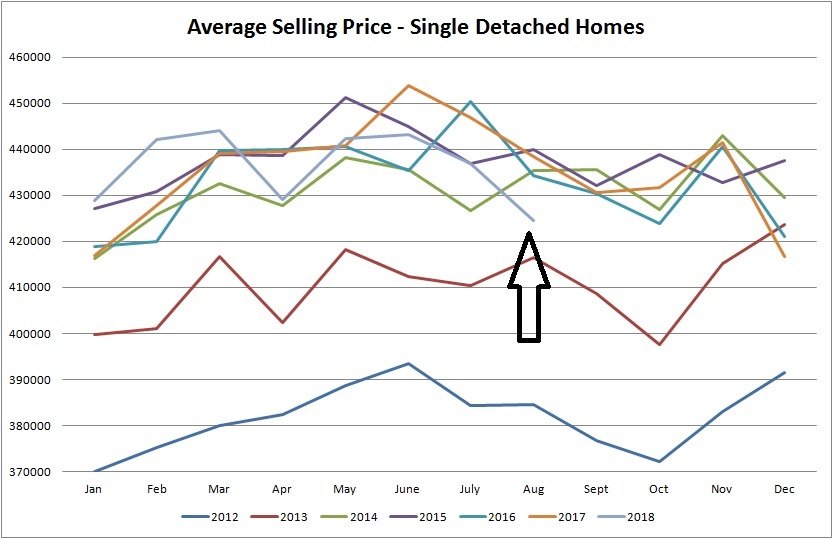
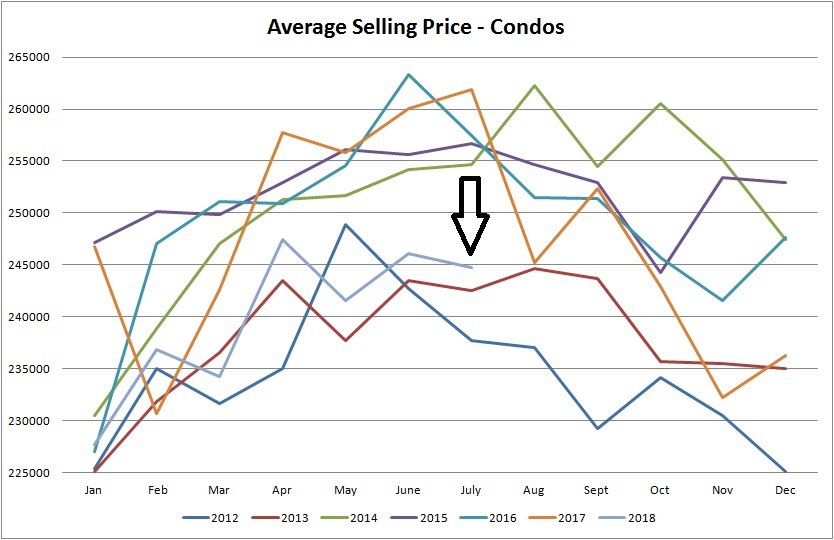
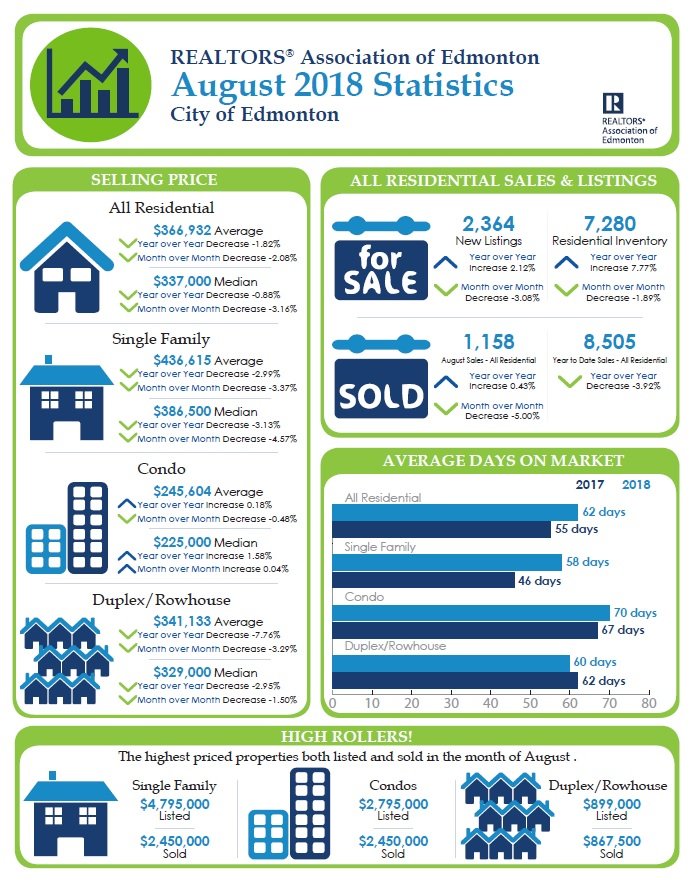
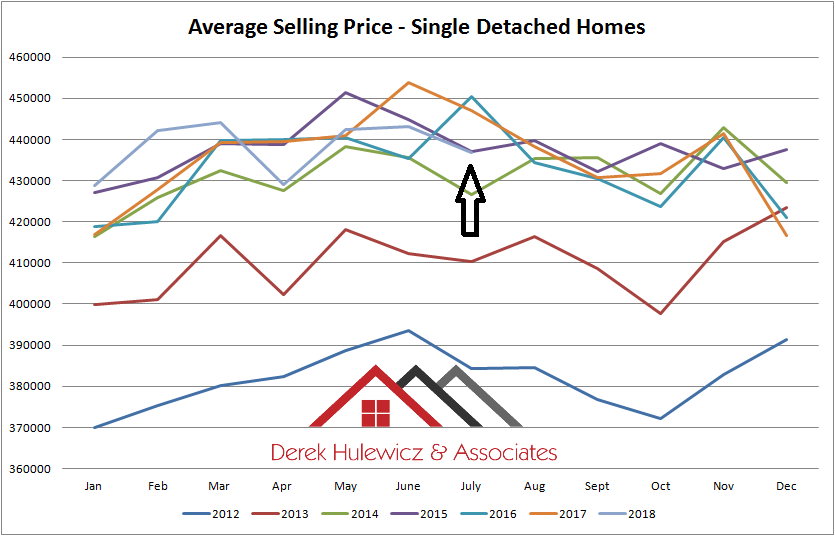
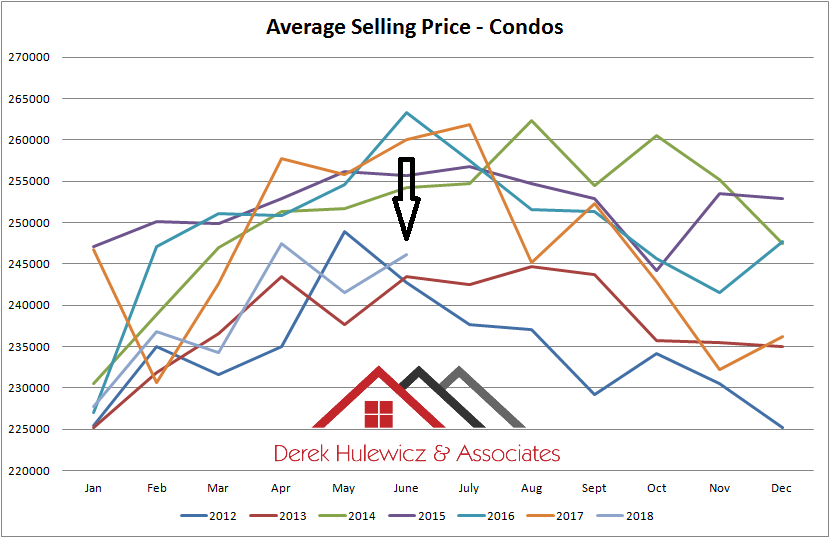
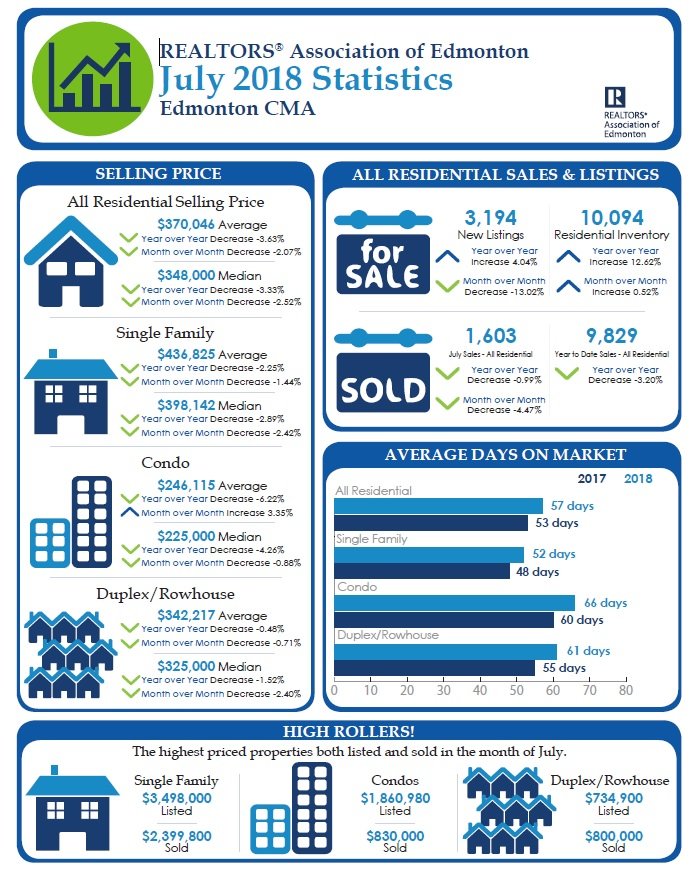
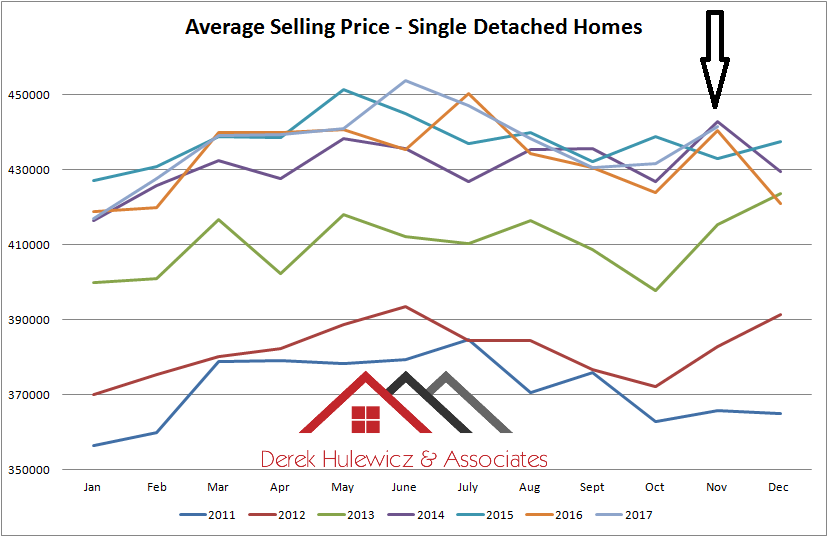
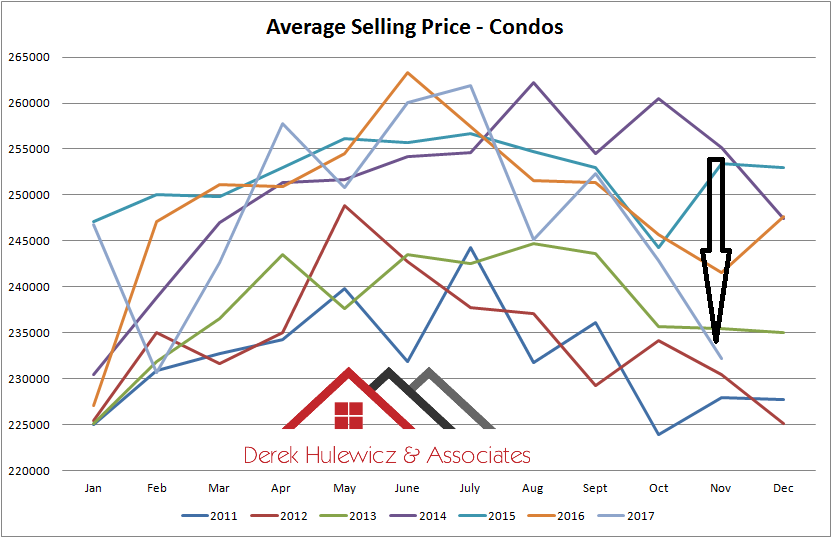
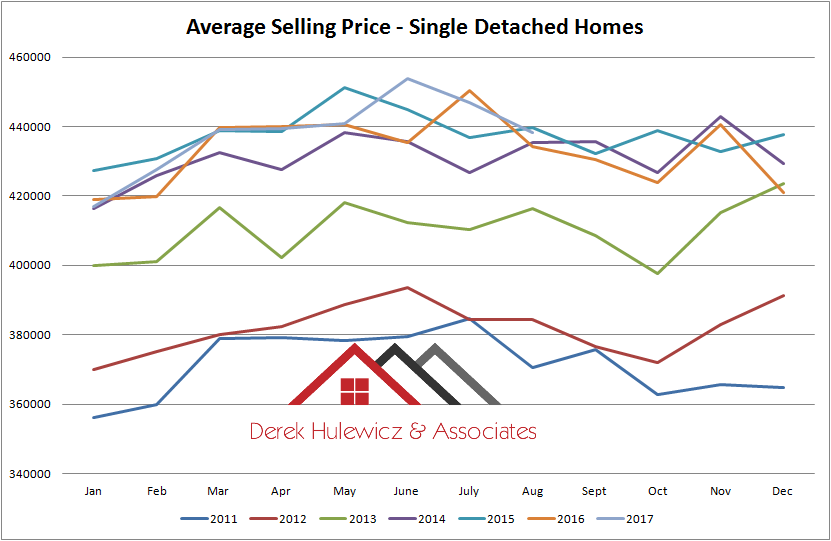
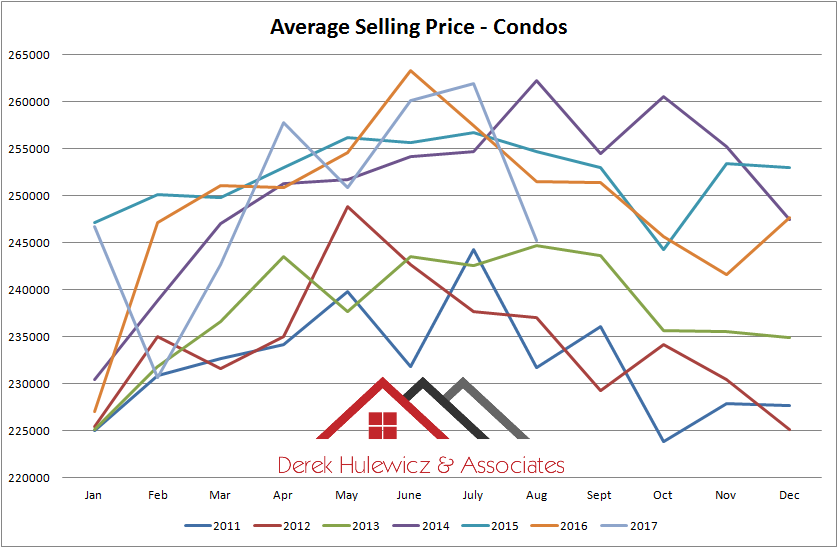
The average price for a single family detached home in August of 2018 was $424,471 down by 2.83% from last month and down by 3.23% from August of 2017. The condo prices were also down slightly by 0.57% at 244,701 from $246,115 last month.

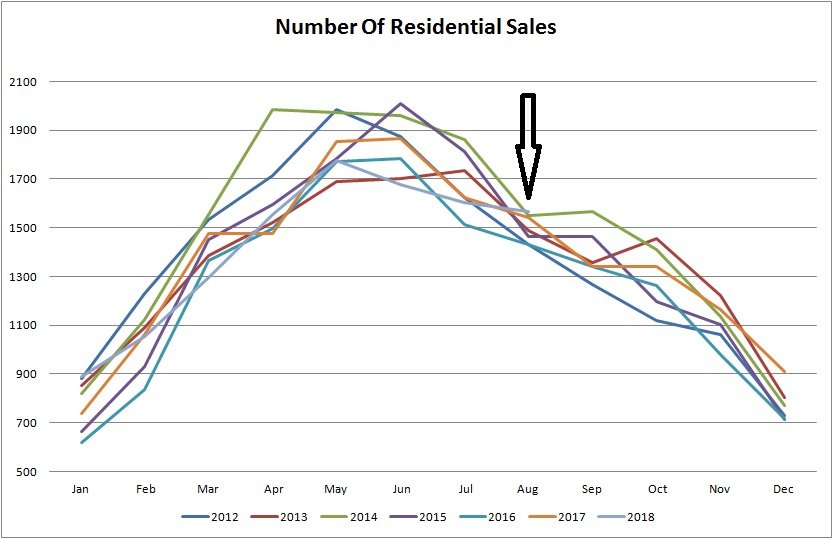
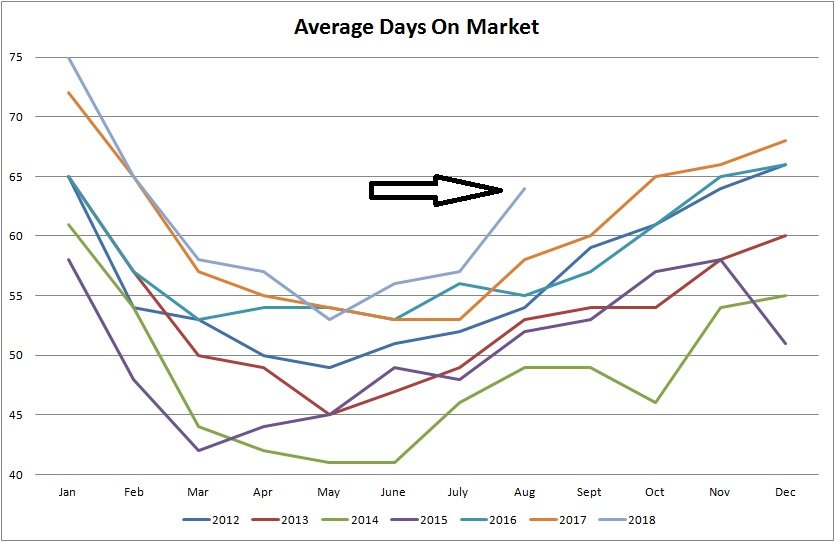
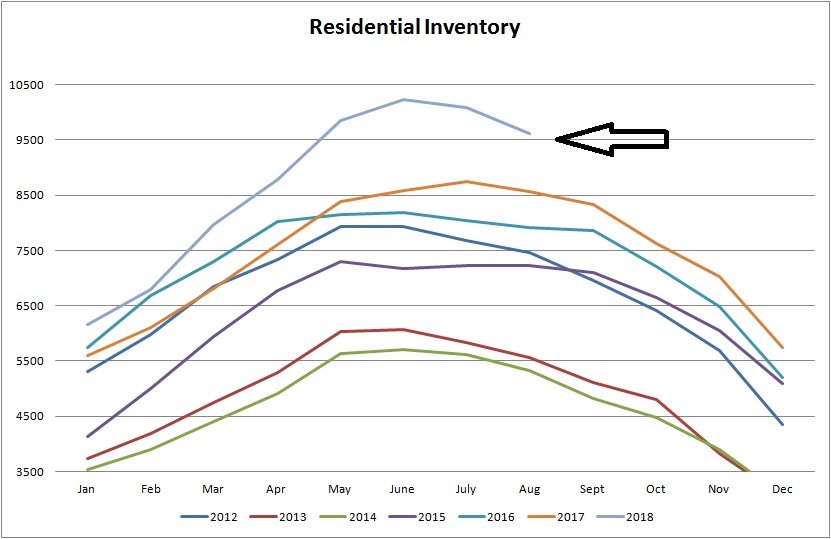
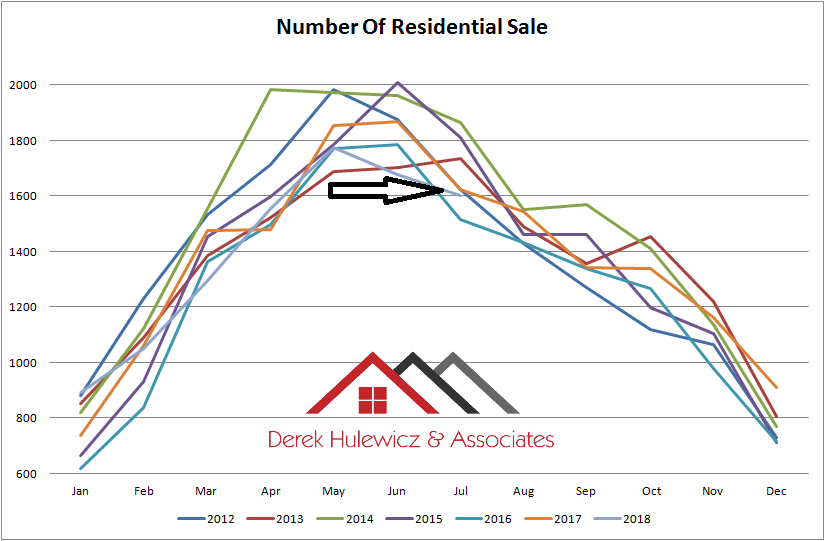
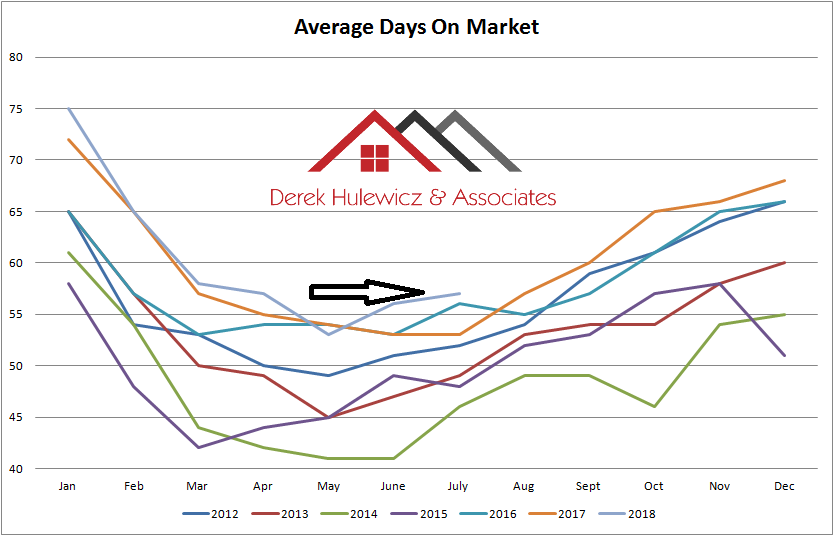
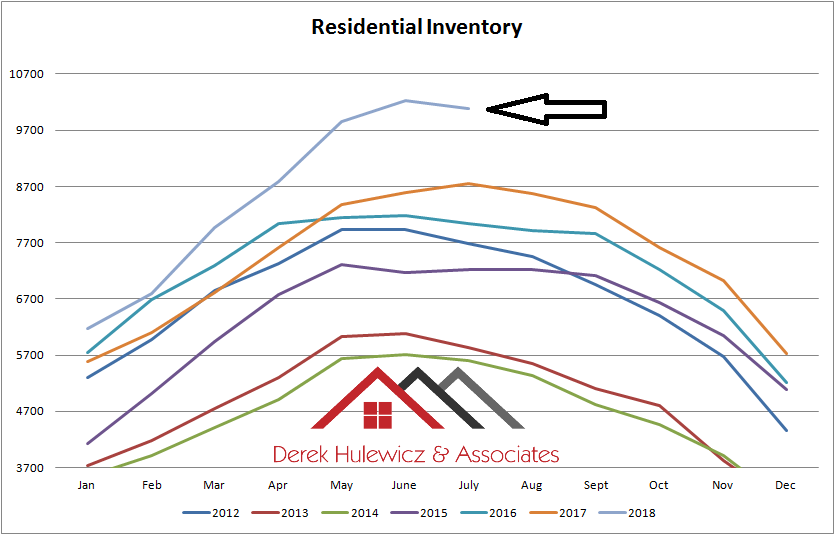
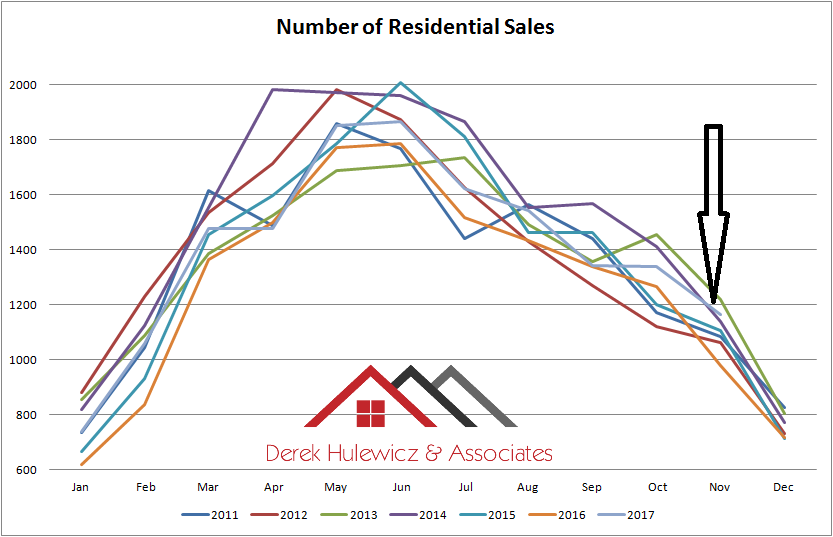
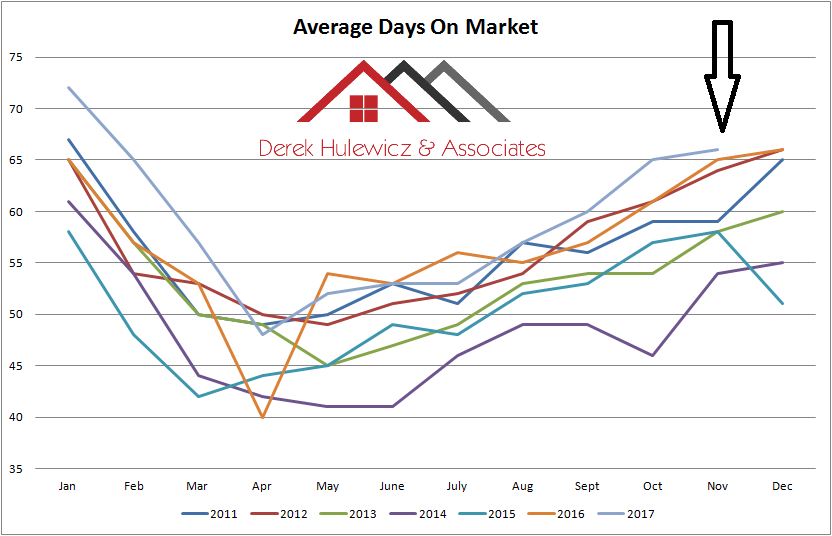
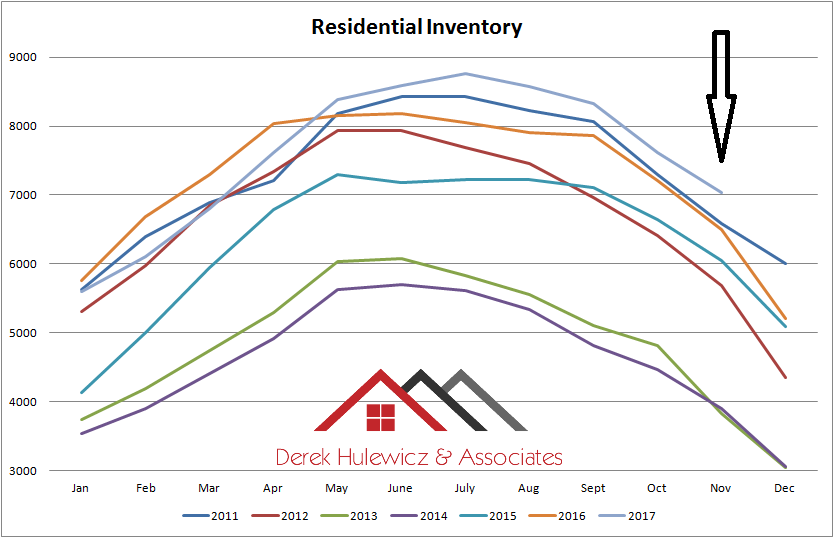
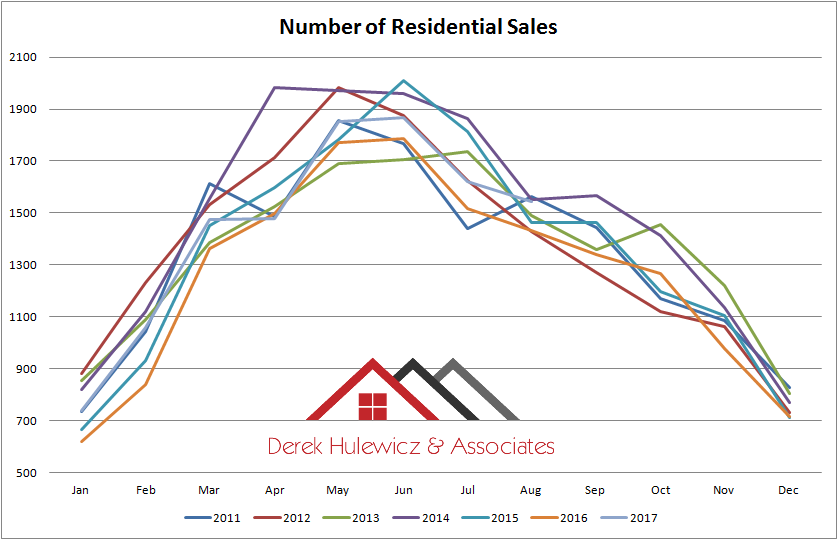
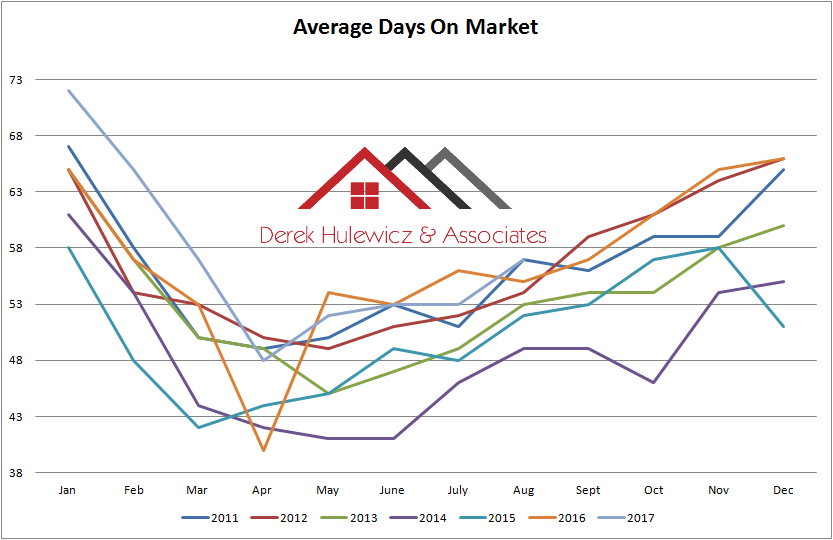
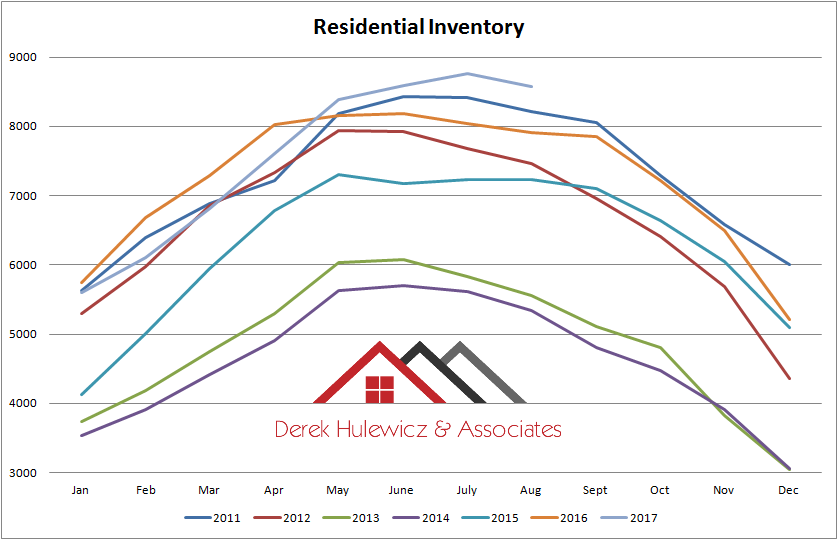
Total of 1,567 residential properties have sold in the 8th month of 2018, 4.51% less than in July and 1.63% more than in same period last year. The inventory decreased to 9,618 residential properties available compared to 10,094 last months and 8,570 in August of 2017. Average Days-On-Market were up by 7 days at 64.

All the information in this article has been provided by Realtors® Association of Edmonton!

real estate stats for average selling price  for single detached homes sold in Edmonton from January of 2012 to August of 2018

real estate stats for average selling price  for condos sold in Edmonton from January of 2012 to August of 2018

real estate stats for number of residetnial properties sold in Edmonton from January of 2012 to August of 2018

real estate stats for average days on market for residential properties sold in Edmonton from January of 2012 to August of 2018

real estate stats for inventory for residential properties sold in Edmonton from January of 2012 to August of 2018

real estate stats for edmonton housing market for august of 2018


955 Views, 0 Comments

The average price for a single family detached home in July of 2018 was $436,825 down by 1.44% from last month and down by 2.25% from July of 2017. On the other hand, the condo prices were up by 3.35% at 246,115 from $238,141 last month.

Total of 1,603 residential properties have sold in the 7th month of 2018, 4.47% less than in June and 0.99% less than in same period last year. The inventory decreased to 10,094 residential properties available compared to 10,230 last months and 8,756 in July of 2017. Average Days-On-Market were up by 1 days at 57.

All the information in this article has been provided by Realtors® Association of Edmonton!

 graph for average selling prices of houses in edmonton from january of 2012 to july of 2018

graph for average selling prices of condos in edmonton from january of 2012 to july of 2018

graph for number of residential propertties sold in edmonton from january of 2012 to july of 2018

graph for average days on market for homes and condos sold in edmonton from january of 2012 to july of 2018

graph for residential inventory for properties for sale in edmonton from january of 2012 to july of 2018

statistics graph for residetnial real estate in edmonton for july of 2018


1,406 Views, 0 Comments

The residential inventory has been rising for a while now and number of sales is slightly lower in June. These two factors are definitely adding pressure to the sellers who may be inclined to lower the price in order to sell. While supply of homes and condos in the Great Edmonton real estate market is increasing, the prices so far remain almost unchanged. Sooner than later, something has to give. Also, Bank of Canada just increased the rates again which is definitely not helping current situation. On the positive note, we still have a stable economy and Edmonton's housing market which is rather inexpensive compared to other cities.

The average price for a single family detached home in June of 2018 was $443,210 up by 0.19% from last month and down by

1,032 Views, 0 Comments

Wow! What is going on with the housing market? The residential inventory is at the record high yet the prices remain stable, especially for single detached home. Are we about to experience a soft decline?

The average price for a single family detached home in May of 2018 was $442,348 up by 3.08% from last month and up by 0.4% from May of 2017. The condo prices were down by 2.36% at 241,571 from $247,405 last month. Total of 1,776 residential properties have sold in the 5th month of 2018, 14.2% more than in April and 3.6% less than in same period last year. The inventory increased to 9,859 residential properties available compared to 8,788 last months and 8,385 in May of 2017. Average Days-On-Market were down by 4 days at 53.

All the information in

1,097 Views, 0 Comments

Looking at the April's and the last few months numbers, one can only wonder if the current conditions and stats are indication of a stagnant Edmonton housing market to come. The increase in the residential inventory, average "days on market" and lower number of sales (except in April) compared to the past few years, definitely point towards it.  If we look at the current condition of our economy, rising interest rates and tougher mortgage rules, combined with record high personal debt, I think it may be a while before we will see any sight of expansion and increases in pricing. On a positive note, we all have to live somewhere and there are always buyers looking to buy that first dream home, move or down size!

Note: this is an opinion of just one

1,291 Views, 0 Comments

As prices of homes in Edmonton and surrounding areas remain stable, we have seen increase in inventory in 2018 and decrease in number of sales compared to last few years. 

The average price for a single family detached home in March of 2018 was $444,091 up by 0.43% from last month and up by 1.06% from March of 2017. The condo prices were down by 1.1% at 234,212 from $236,808 last month. Total of 1,294 residential properties have sold in the 3rd month of 2018, 23% more than in February and 11.73% less than in same period last year. The inventory increased to 7,963 residential properties available compared to 6,797 last months and 6,806 in March of 2017.

Average Days-On-Market were down by 5 day at 60. All the information in this article has been

1,108 Views, 0 Comments

One can only say "What a strange market". Despite increased inventory and lower sales compared to last year, current prices of homes in Edmonton are slightly up. One can only assume that most of the sellers are not willing to reduce the prices on their listings, regardless of how long their homes have been on the market. Are the sellers playing a game of chicken with the buyers or simple can't afford to sell their properties for less that they bought them in the last few years. I guess we will see more clearly in the next few months.

The average price for a single family detached home in February of 2018 was $442,206 up by 3.14% from last month and up by 3.73% from February of 2017. The condo prices were up by 2.86% at 236,808 from $227,707 last month.

1,211 Views, 0 Comments

The average price for a single family detached home in November of 2017 was $441,526 up by 2.29% from last month and up by 0.23% from November of 2016. The condo prices were down by 4.39% at 232,221 from $242,887 last month.

Total of 1,163 residential properties have sold in the 11th month of 2017, 12.77% less than in October and 12.42% more than in same period last year. The inventory decreased to 7,030 residential properties available compared to 7,618 last months and 6,493 in October of 2016. Average Days-On-Market were up by 1 day at 66.

All the information in this article has been provided by Realtors® Association of Edmonton!

graph for average selling rpcie for single detached homes sold in Edmonton from january of 2011 to november of 2017

graph for average selling rpcie graph fro average selling price of condos sold in Edmonton from january of 2011 to november of 2017

graph for number of residential homes sold in Edmonton from january of 2011 to november of 2017

graph for average days on market for homes sold in Edmonton from january of 2011 to november of 2017

graph for inventory of homes for sale in Edmonton from january of 2011 to november of 2017

Brought to you by Edmonton Homes For Sale Blog!
1,681 Views, 0 Comments

Should we worry?  Despite number of sales decreasing month to month and residential inventory increasing, the housing prices in Edmonton and surrounding area are holding.  The average price for a single family detached home in September of 2017 was $430,644 down by 1.75% from last month and up by 0.17% from September of 2016. The condo prices were up by 2.91% at 252,313 from $245,184 last month.

Total of 1,341 residential properties have sold in the 9th month of 2017, 13.04% less than in August and 6.25% less than in same period last year. The inventory decreased to 8,331 residential properties available compared to 8,570 last months and 7,857 in September of 2016. Average Days-On-Market were up by 3 day at 60.

All the information in this article

1,170 Views, 0 Comments

The average price for a single family detached home in August of 2017 was $438,325 down by 1.92% from last month and down by 0.83% from August of 2016. The condo prices were also down by 6.37% at 245,184 from $261,861 last month.

Total of 1,542 residential properties have sold in the 8th month of 2017, 4.93% less than in July and 2.03% less than in same period last year.The inventory decreased to 8,570 residential properties available compared to 8,756 last months and 7,909 in August of 2016. Average Days-On-Market were up by 4 day at 57.

All the information in this article has been provided by Realtors® Association of Edmonton!

graph for average selling price for single detached homes sold in edmonton from january of 2010 to august of 2017

graph for average selling price for condominiums sold in edmonton from january of 2010 to august of 2017

graph for number of resedential properties sold in edmonton from january of 2010 to august of 2017

graph for average days on market of homes sold in edmonton from january of 2010 to august of 2017

graphgraph for residential inventory of homes for sale in edmonton from january of 2010 to august of 2017

Brought to you by: Edmonton homes for sale blog!

1,130 Views, 0 Comments

Sign up for email updates