Edmonton Real Estate Update

Monthly real estate market update for Edmonton with graphs and statistics.  Comments on value and performance on Edmonton's real estate market.

Found 82 blog entries about Edmonton Real Estate Update.

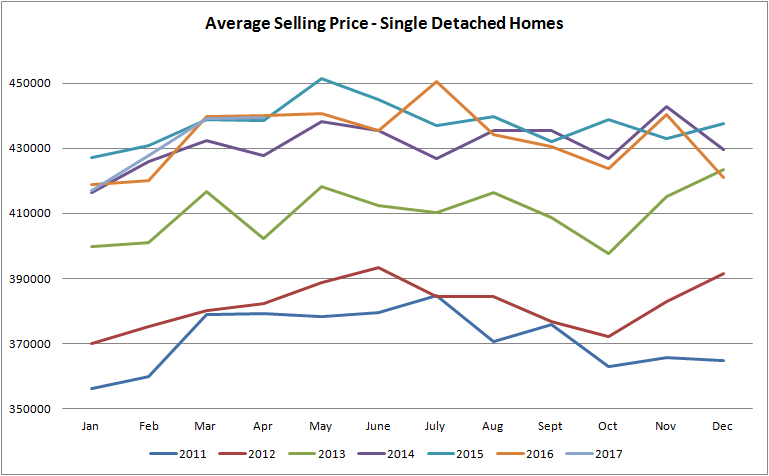
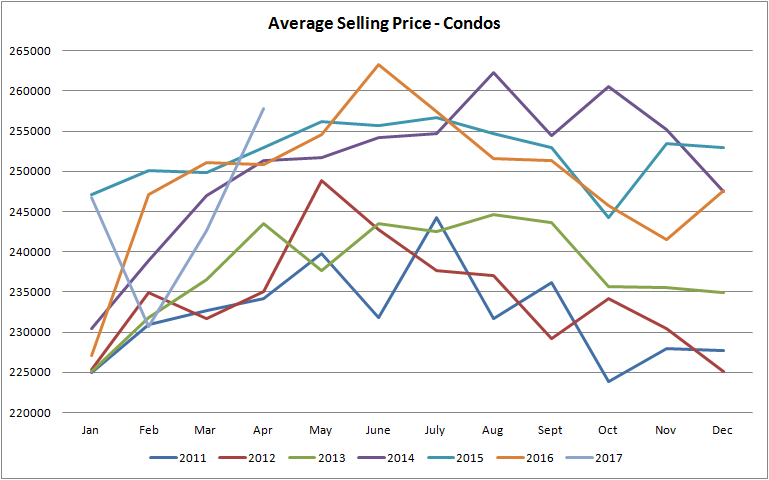
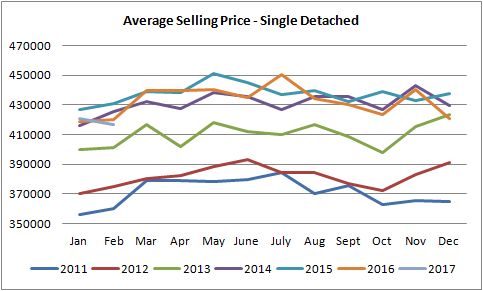
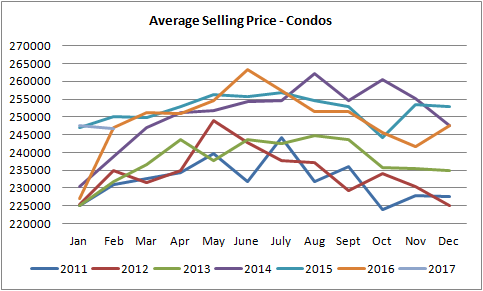
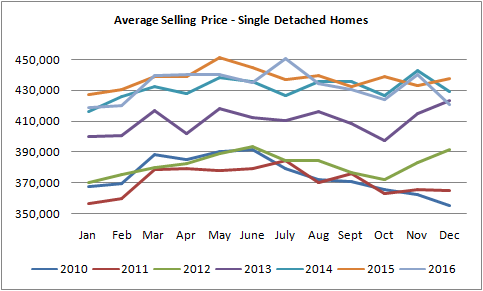
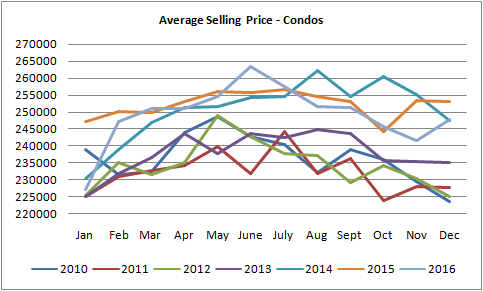
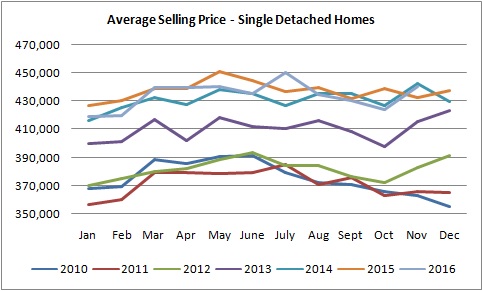
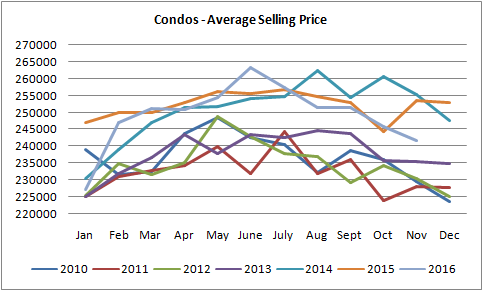
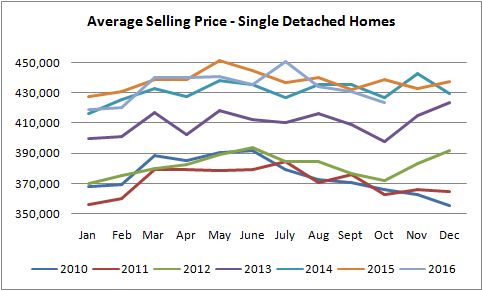
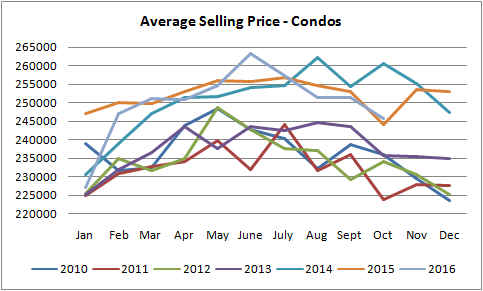
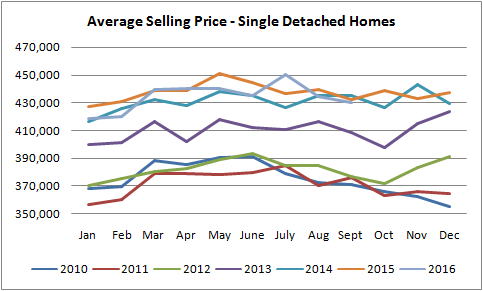
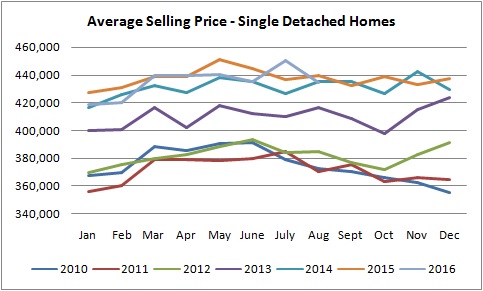
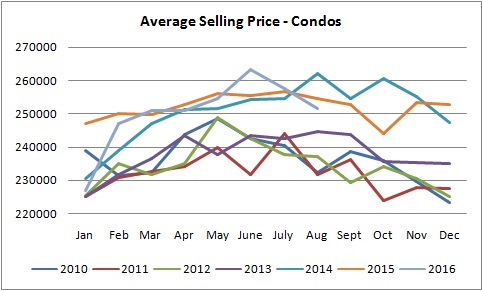
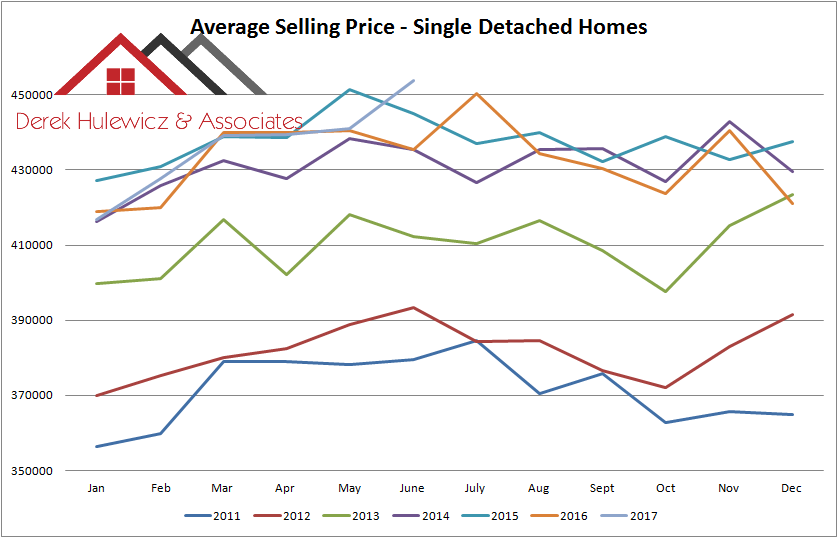
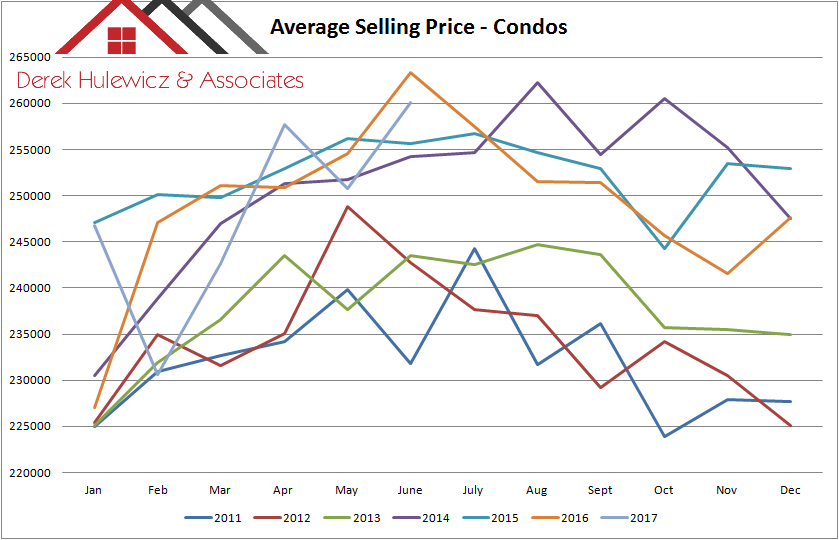
The average price for a single family detached home in June of 2017 was $453,735 up by 2.91% from last month and up by 4.37% from June of 2016. The condo prices were also up by 3.69% at 260,084 from $250,818 last month.

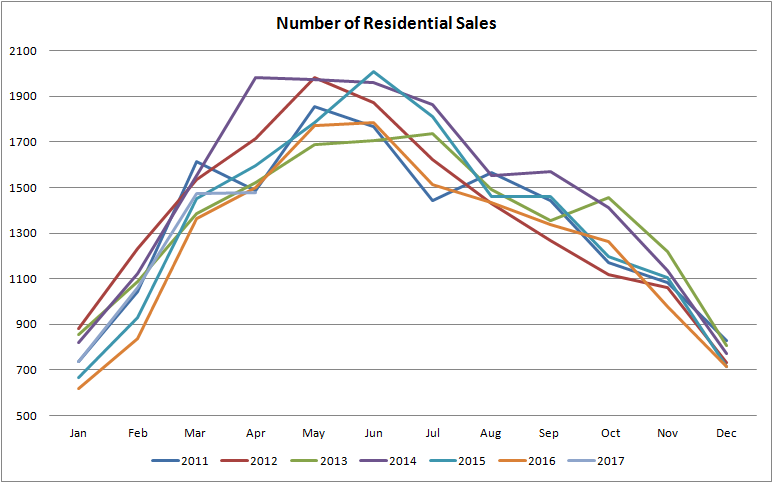
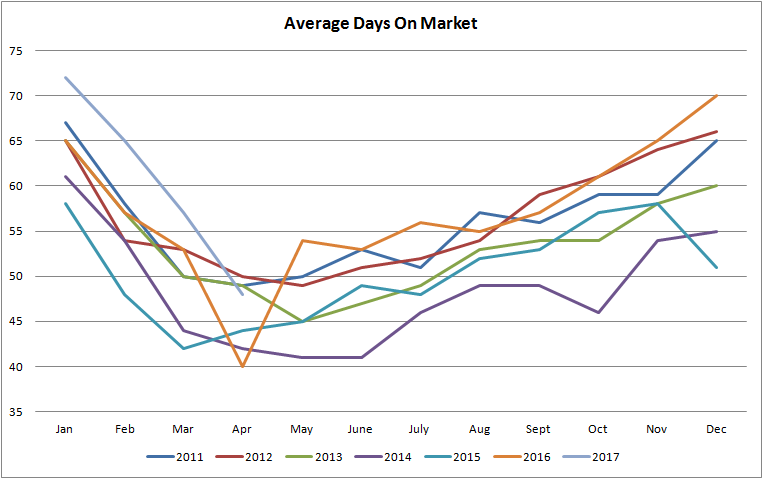
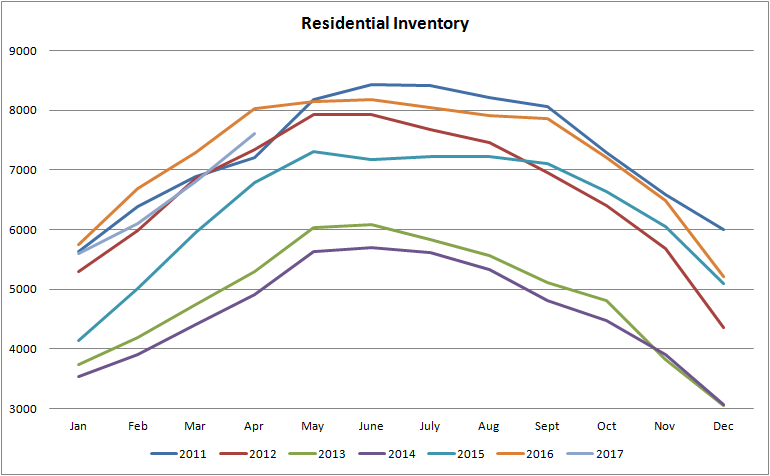
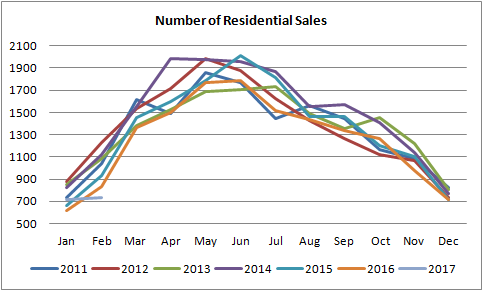
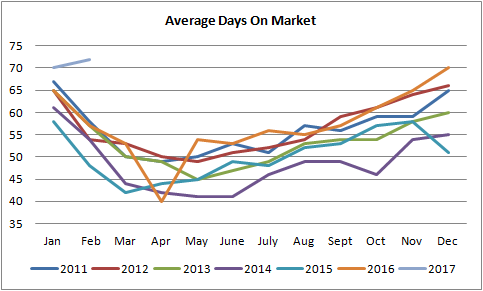
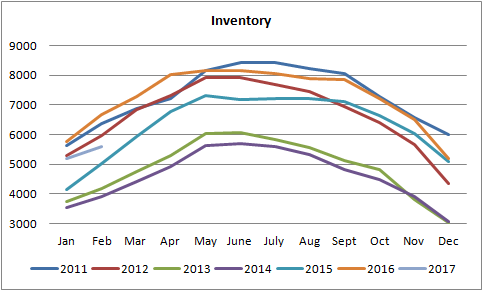
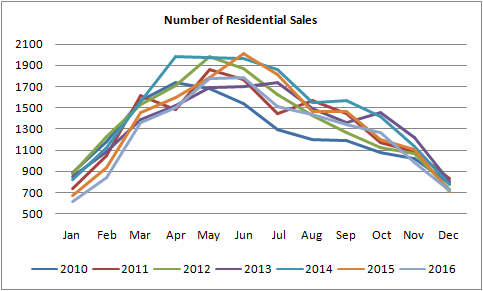
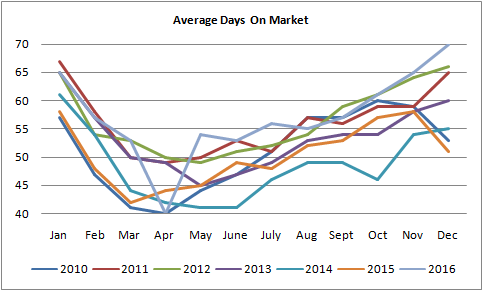
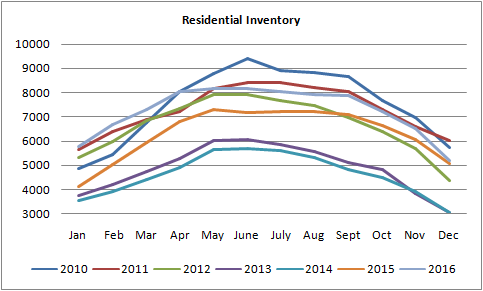
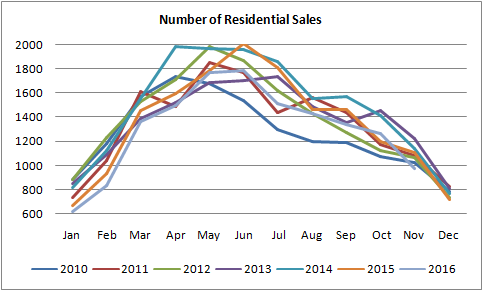
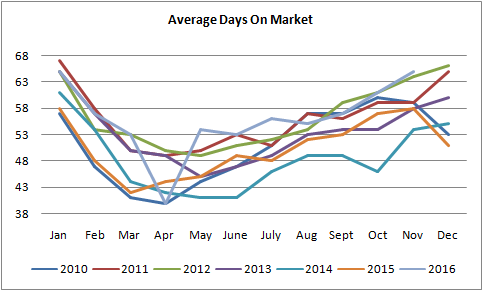
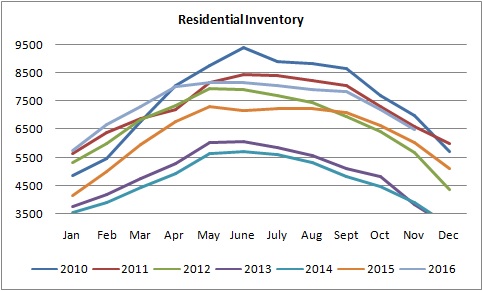
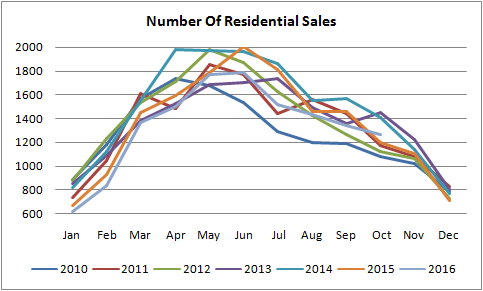
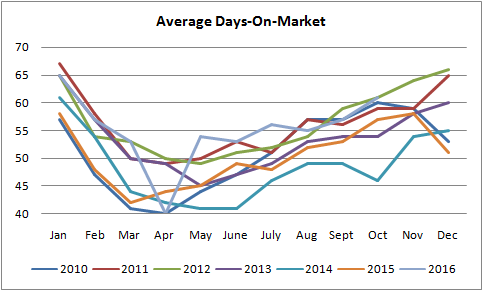
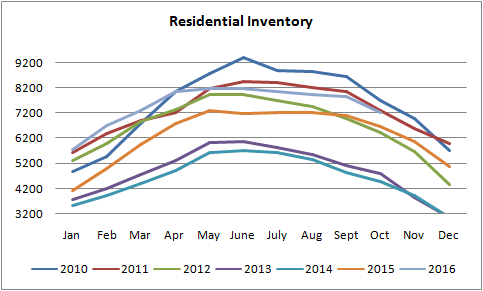
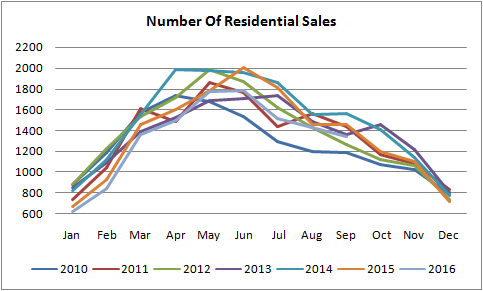
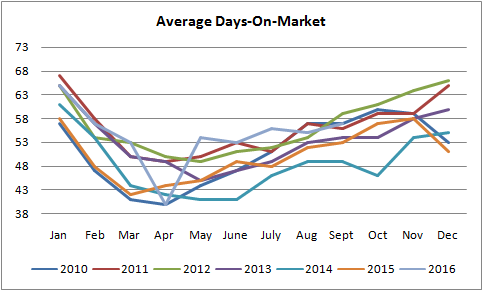
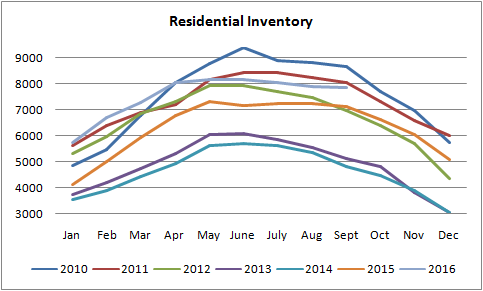
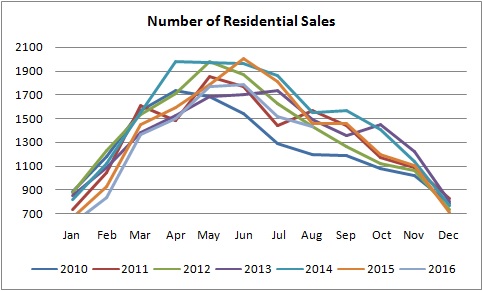
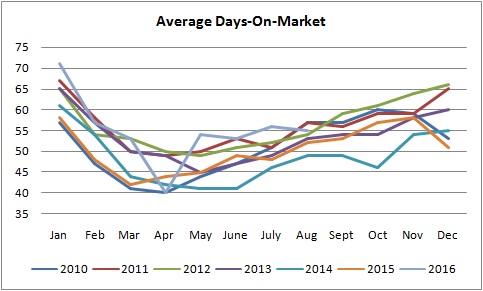
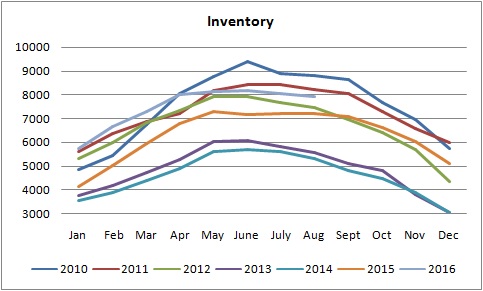
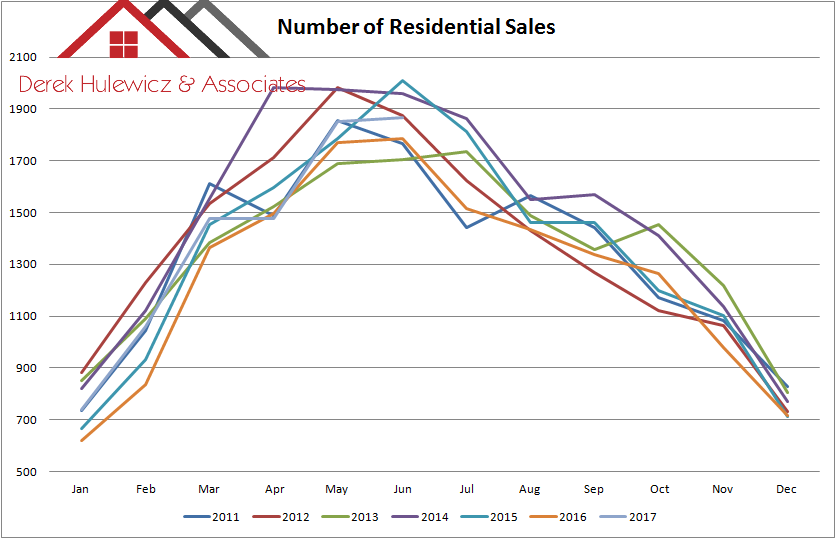
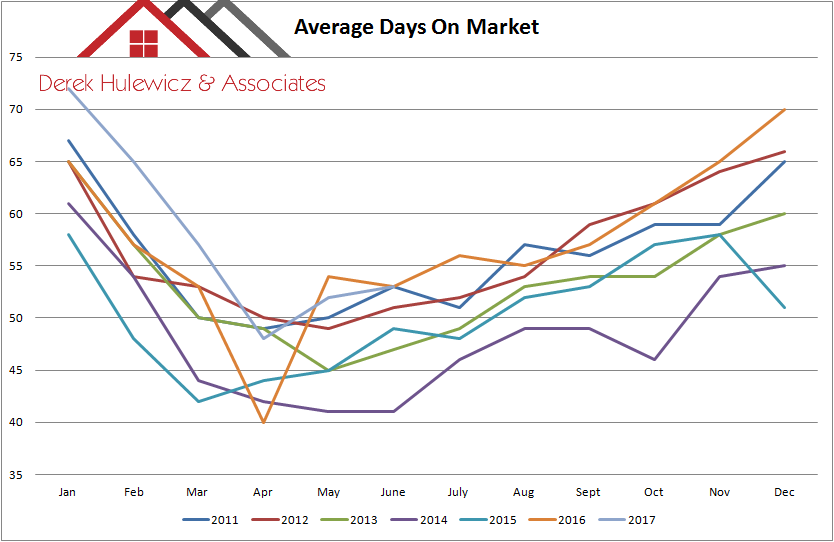
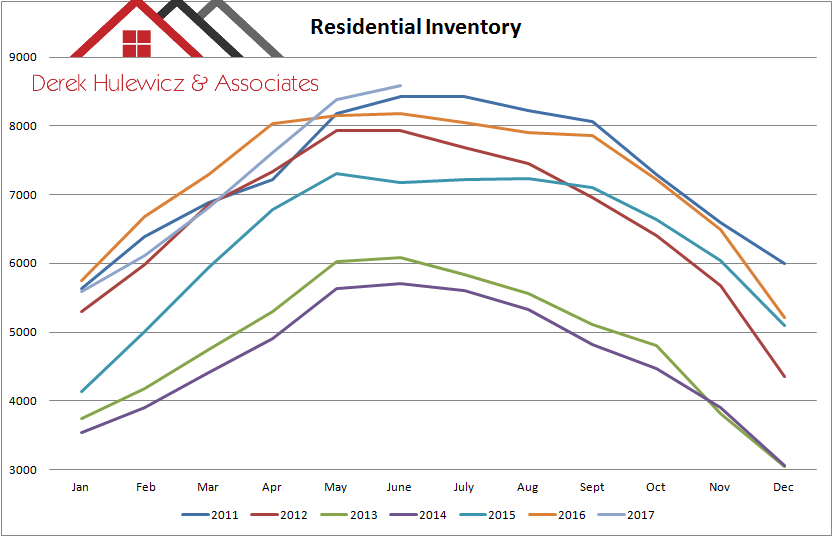
Total of 1,867 residential properties have sold in the 6th month of 2017, 0.76% more than in May and 0.74% less than in same period last year. The inventory increased to 8,586 residential properties available compared to 8,385 last months and 8,179 in June of 2016. Average Days-On-Market were up by 1 day at 53.

All the information in this article has been provided by Realtors® Association of Edmonton!

graph for average selling price of houses in edmonton from january of 2011 to june of 2017

graph for average selling price of condos in edmonton from january of 2011 to june of 2017

graph for number of residential sales in edmonton from january of 2011 to june of 2017

graph for average days on the market for residential properties sold in edmonton from january of 2011 to june of 2017

graph for residential inventory in edmonton from january of 2011 to june of 2017

Brought to you by Edmonton homes for sale blog!

4,053 Views, 0 Comments

Edmonton real estate prices remain unchanged and average number of sales compared to prior years indicates a stable market. The increasing inventory in the last few month, may indicate the possible market decline, if it continues to rise. However, at this point we should wait and see how much it increases and if it does at all in the next couple of months.

The average price for a single family detached home in May of 2017 was $440,907 up by 0.3% from last month and up by 0.3% from May of 2016. The condo prices were down by 2.7% at 250,818 from $257,740 last month. Total of 1,853 residential properties have sold in the 5th month of 2017, 25% more than in April and 2.8% less than in same period last year. The inventory increased to 8,385 residential

4,185 Views, 0 Comments

The average price for a single family detached home in April of 2017 was $439,438 up by 0.07% from last month and up by 0.03% from April of 2016. The condo prices were also up by 6.23% at 257,740 from $242,263 last month.

Total of 1,478 residential properties have sold in the 4th month of 2017, 0.27% more than in March and 6.99% less than in same period last year. The inventory increased to 7,612 residential properties available compared to 6,806 last months and 8,033 in April of 2016. Average Days-On-Market were down by 9 days at 48.

All the information in this article has been provided by Realtors® Association of Edmonton!

graph for average selling price for houses sold in edmonton from january of 2011 to april of 2017

graph for average selling price for condos sold in edmonton from january of 2011 to april of 2017

graph fo number of residential properties sold in edmonton from january of 2011 to april of 2017

graph for average days on the market for properties sold in edmonton from january of 2011 to april of 2017

graph for residential inventory for homes for sale in edmonton from january of 2011 to april of 2017

Brought to you by: Edmonton homes for sale blog!

3,820 Views, 0 Comments

February was definitely a busy month for all the realtors compared to last year. Despite weaker economy, the Edmonton's real estate market is better than many have thought.

The average price for a single family detached home in February of 2017 was $427,726 up by 2.61% from last month and up by 1.85% from February of 2016. The condo prices were down by 6.51% at 230,661 from $246,727 last month.

Total of 1,060 residential properties have sold in the 2nd month of 2017, 43.6% more than in January and 26.6% more than in same period last year. The inventory increased to 6,108 residential properties available compared to 5,594 last months and 6,681 in February of 2016. Average Days-On-Market were down by 7 days at 65.

All the information in this

1,585 Views, 1 Comment

The average price for a single family detached home in January of 2017 was $416,859 down by 0.97% from last month and down by 0.49% from January of 2016. The condo prices were also down by 0.57% at 246,727 from $247,647 last month.

Total of 738 residential properties have sold in the first month of 2017, 2.9% more than in December and 16.2% more than in same period last year. The inventory increased to 5,594 residential properties available compared to 5,208 last months and 5,751 in January of 2016. Average Days-On-Market were up by 2 days at 72.

All the information in this article has been provided by Realtors® Association of Edmonton!

graph for single detached houses sold in edmonton from january of 2011 to january of 2017

graph for condos sold in edmonton from january of 2011 to january of 2017

graph for all the residential sales of homes and condos sold in edmonton from january of 2011 to january of 2017

graphgraph for days on market of properties sold in edmonton from january of 2011 to january of 2017

graphgraph for residential invetory of homes for sale in edmonton from january of 2011 to january of 2017

Brought to you by Edmonton homes for sale blog!

1,557 Views, 0 Comments

The average price for a single family detached home in December of 2016 was $420,962, down by 4.4% from last month and down by 0.8% from December of 2015. The condo prices were up by 2.5% at 247,647 from $241,569 last month.

Total of 716 residential properties have sold in the 12th month of 2016, 27% less than in November and 0.4% more than in same period last year. The inventory decreased to 5,208 residential properties available compared to 5,088 last months and 6,043 in December of 2015. Average Days-On-Market were up by 5 days at 70.

All the information in this article has been provided by Realtors® Association of Edmonton!

graph for average selling prices for homes sold in Edmonton from January of 2010 to December of 2016

graph for average selling prices for condos sold in Edmonton from January of 2010 to December of 2016

graph for number of residential homes sold in Edmonton from January of 2010 to December of 2016

graph for average days on market for homes sold in Edmonton from January of 2010 to December of 2016

graph for residential inventory of homes for sale in Edmonton from January of 2010 to December of 2016

Brought to you by Edmonton Homes For Sale Blog!

1,457 Views, 0 Comments

The average price for a single family detached home in November of 2016 was $440,496, up by 3.95% from last month and up by 1.7% from November of 2015. The condo prices were down by 1.6% at 241,569 from $245,698 last month.

Total of 978 residential properties have sold in the 11th month of 2016, 22% less than in October and 11% less than in same period last year. The inventory decreased to 6,493 residential properties available compared to 7,215 last months and 6,043 in November of 2015. Average Days-On-Market were up by 4 days at 65.

All the information in this article has been provided by Realtors® Association of Edmonton!

graph for single detached homes sold in edmonton from january of 2010 to november of 2016

graph for sgraph for condos sold in edmonton from january of 2010 to november of 2016

graph for number of sales for residential properties sold in edmonton from january of 2010 to november of 2016

graph for average days on market for homes sold in edmonton from january of 2010 to november of 2016

graph for the residential inventory of homes for sale in edmonton from january of 2010 to november of 2016

Brought to you by Edmonton Home For Sale Blog!

1,295 Views, 0 Comments

The average price for a single family detached home in October of 2016 was $423,755, down by 1.6% from last month and down by 1.7.% from October of 2015. The condo prices were also down by 2.3% at 245,698 from $251,365 last month.

Total of 1,265 residential properties have sold in the 10th month of 2016, 5.5% less than in September and 5.2% more than in same period last year. The inventory decreased to 7,215 residential properties available compared to 7,857 last months and 6,641 in October of 2015. Average Days-On-Market were up by 4 days at 61.

All the information in this article has been provided by Realtors® Association of Edmonton!

graph for average selling price for houses sold in edmonton from january of 2010 to november of 2016

graph for average selling price for condos sold in edmonton from january of 2010 to november of 2016

graph for number of residential sales in edmonton from january of 2010 to november of 2016

graph for average days on market for properties sold in edmonton from january of 2010 to november of 2016

graph for inventory of homes sold in edmonton from january of 2010 to november of 2016

Brought to you by Edmonton homes for sale blog!

1,078 Views, 0 Comments

The average price for a single family detached home in September of 2016 was $430,461, down less than 1% from last month and down by 0.2% from September of 2015. The condo prices were almost identical at 251,365 from $257,526 last month.

Total of 1,339 residential properties have sold in the 9th month of 2016, 6.6% less than in August and 8.4% less than in same period last year. The inventory decreased to 7,857 residential properties available compared to 7,908 last months and 7,108 in September of 2015. Average Days-On-Market were up by 2 days at 57.

All the information in this article has been provided by Realtors® Association of Edmonton!

average selling price graph for homes sold in edmonton from january of 2010 to september of 2016


average selling price graph for condos sold in edmonton from january of 2010 to september of 2016

number of residential sales graph for homes sold in edmonton from january of 2010 to september of 2016

average days on the market graph for homes selling in edmonton from january of 2010 to september of 2016

inventory graph for homes being sold in edmonton from january of 2010 to september of 2016

Brought to you by Edmonton Homes For Sale Blog!

1,282 Views, 0 Comments

The average price for a single family detached home in August of 2016 was $434,362, down by 4% from last month and down by 1% from August of 2015. The condo prices were also down by 2% at 251,526 from $257,482.

Total of 1,433 residential properties have sold in the 8th month of 2016, 5% less than in July and 2% less than in same period last year. The inventory decreased to 7,909 residential properties available compared to 8,048 last months and 7,227 in August of 2015. Average Days-On-Market were down by 1 day at 55.

All the information in this article has been provided by Realtors® Association of Edmonton!

graph for single detached homes sold in edmonton from january of 2010

graph for condos sold in edmonton from january of 2010

grgraph for number of residential sales of homes sold in edmonton from january of 2010

days on the market graph of homes sold in edmonton from january of 2010

inventory graph fro homes for sale in edmonton from january of 2010

Brought to you by Edmonton homes for sale blog!

1,907 Views, 0 Comments

Sign up for email updates