Edmonton Real Estate Update

Monthly real estate market update for Edmonton with graphs and statistics.  Comments on value and performance on Edmonton's real estate market.

Found 82 blog entries about Edmonton Real Estate Update.

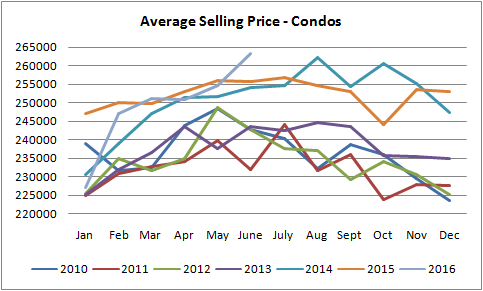
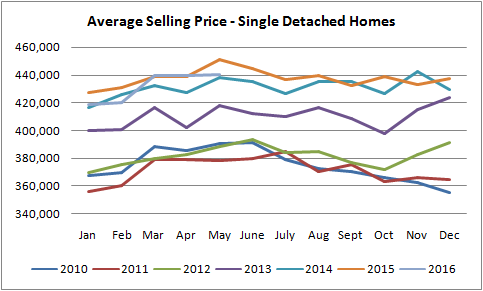
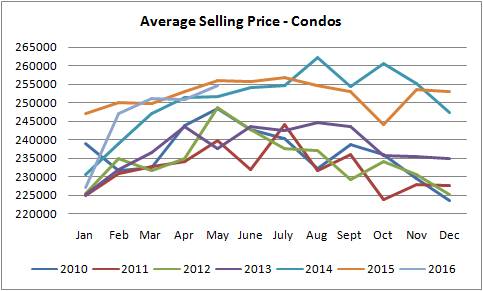
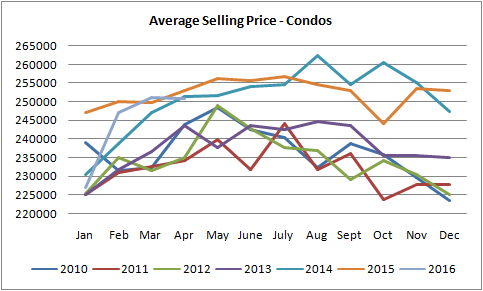
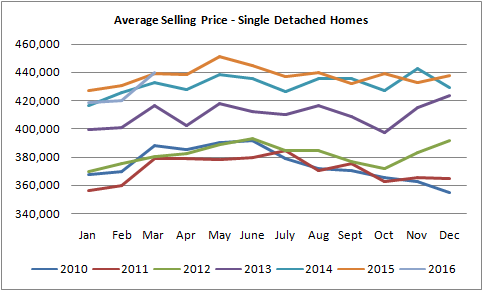
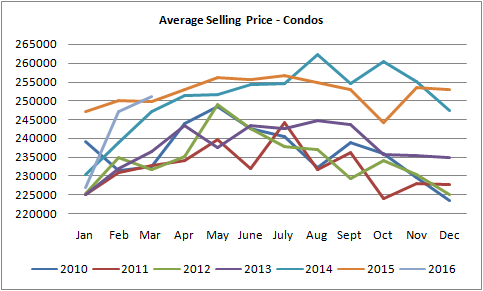
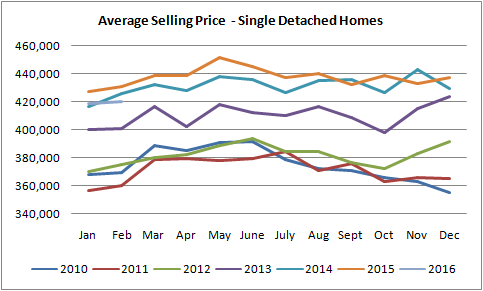
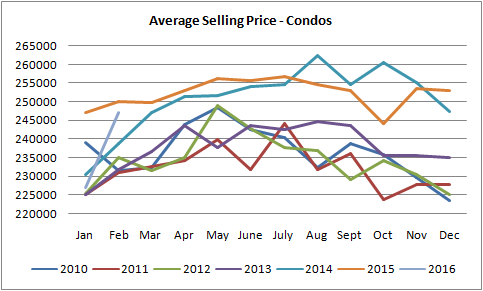
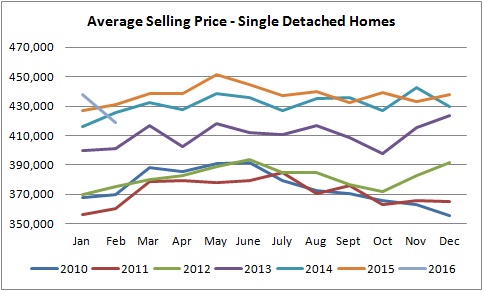
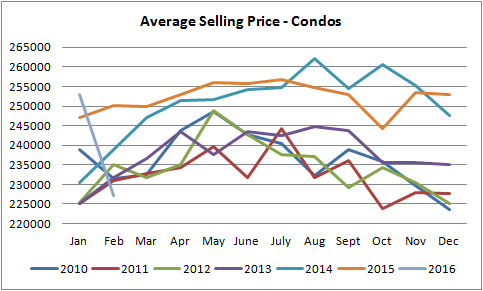
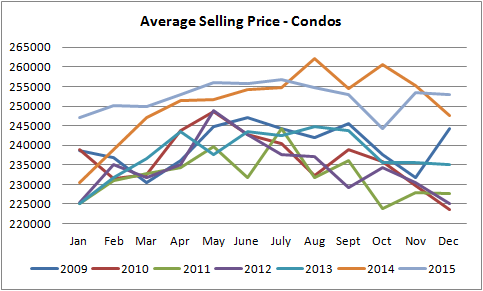
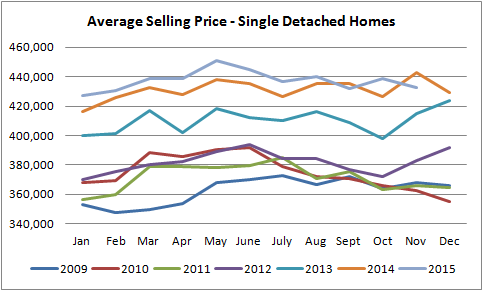
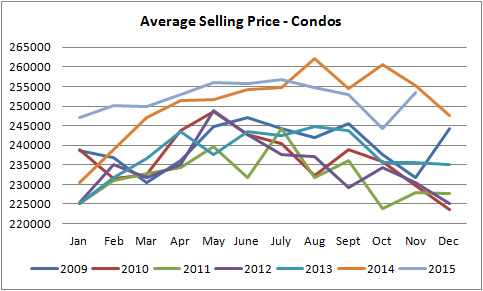
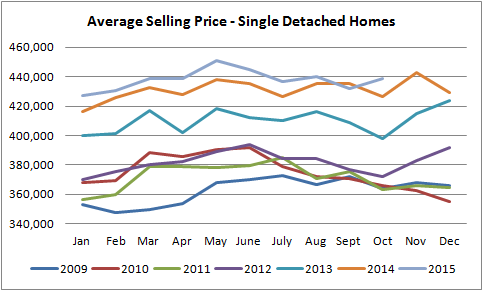
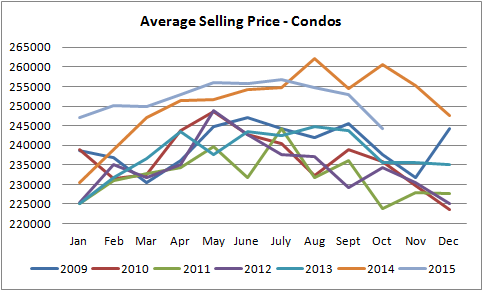
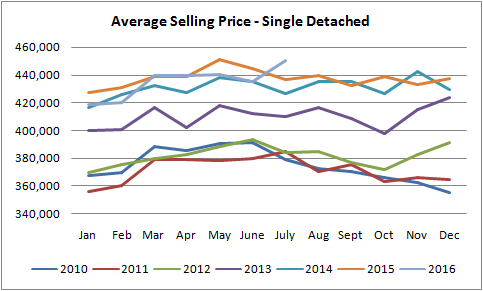
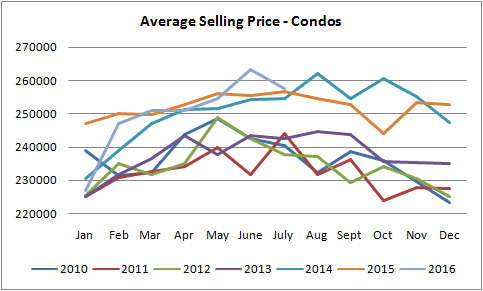
The average price for a single family detached home in July of 2016 was $450,366, up by 3% from last month and up by 3% from July of 2015. The condo prices were down by 2% at 257,482 from $263,366.

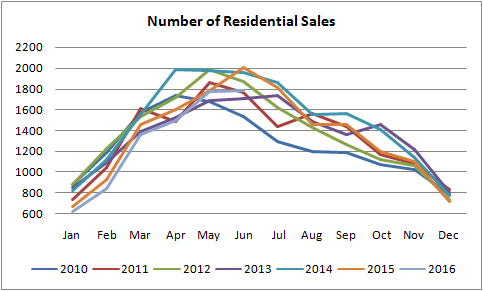
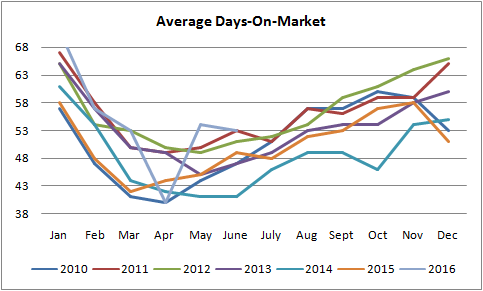
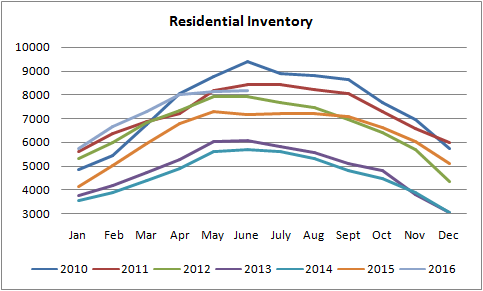
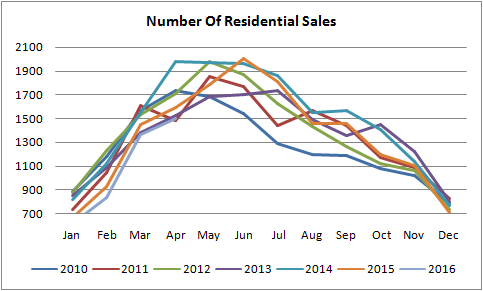
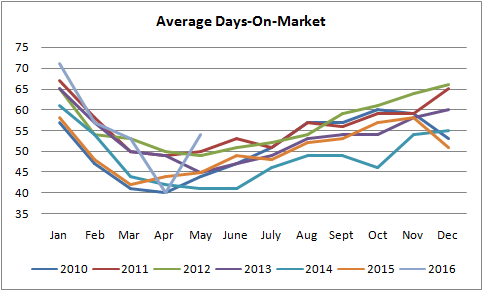
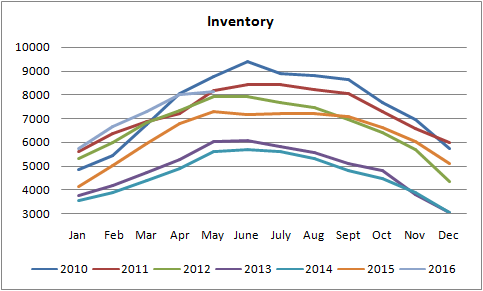
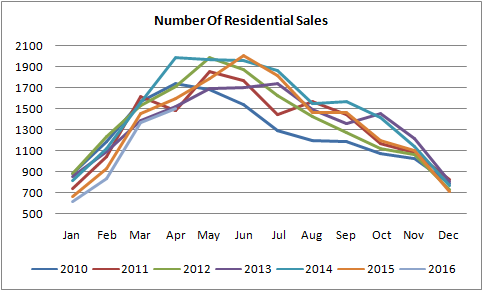
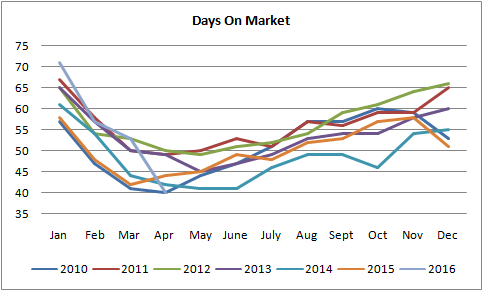
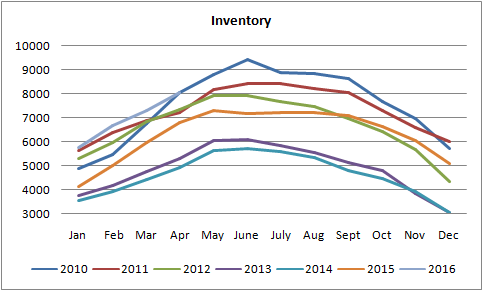
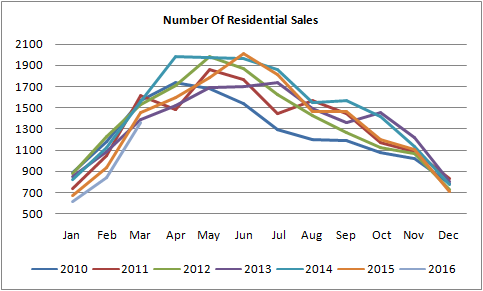
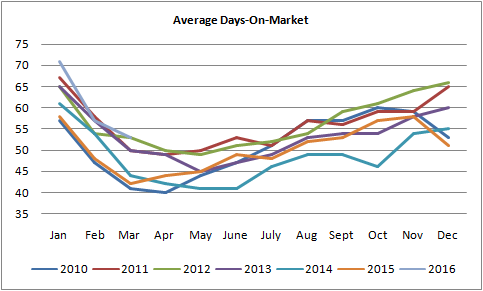
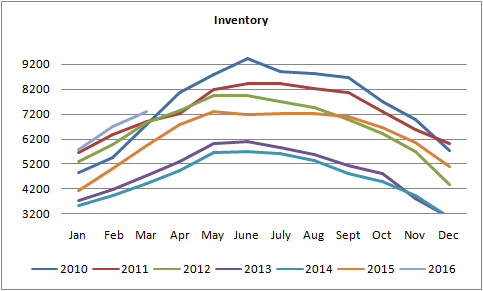
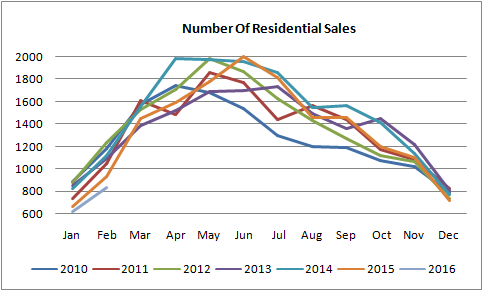
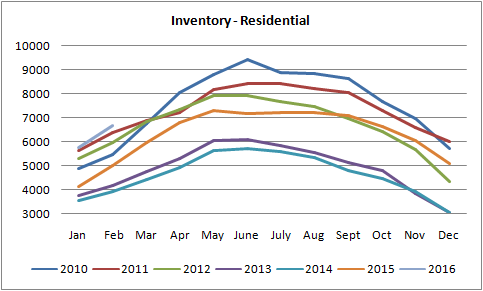
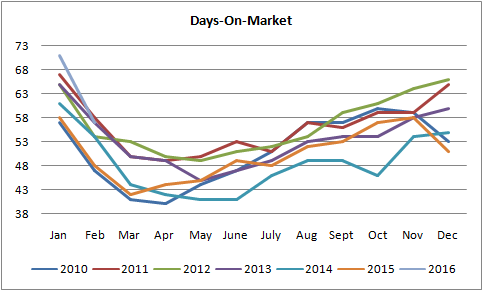
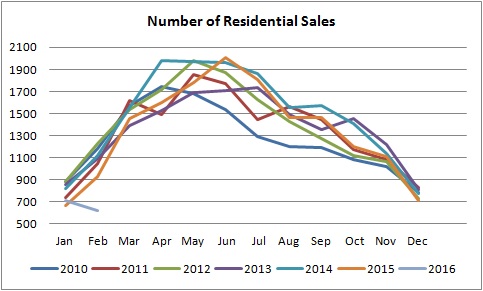
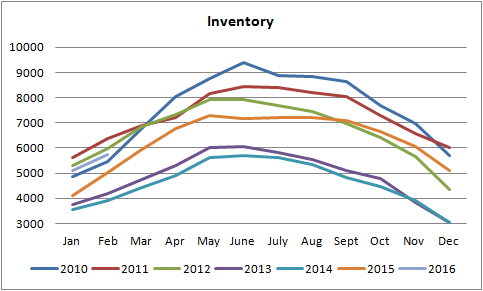
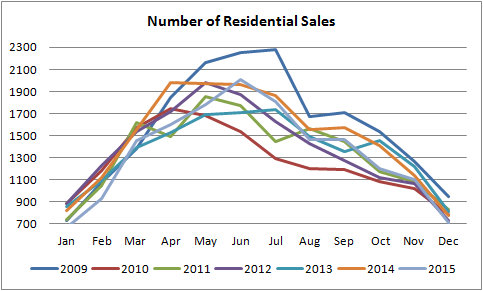
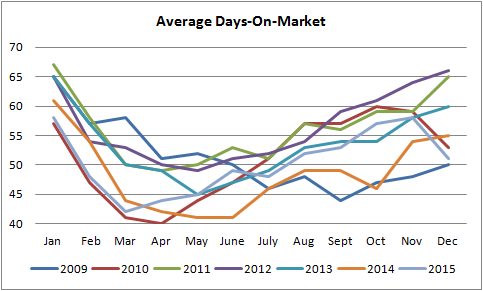
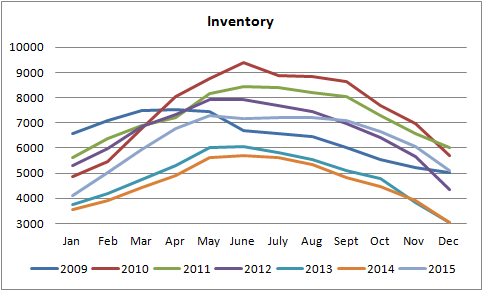
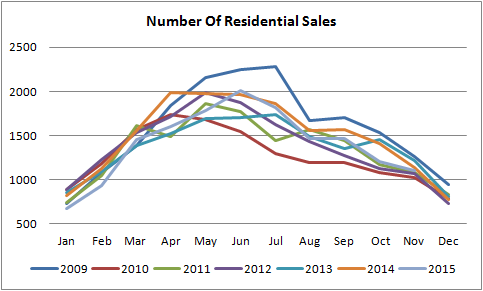
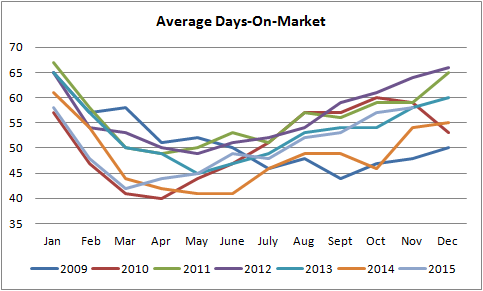
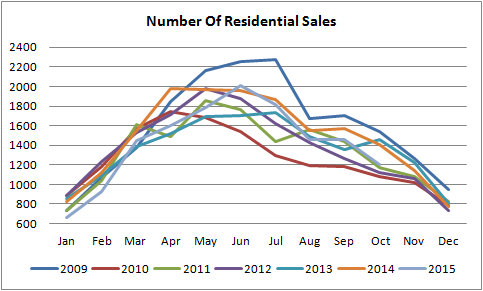
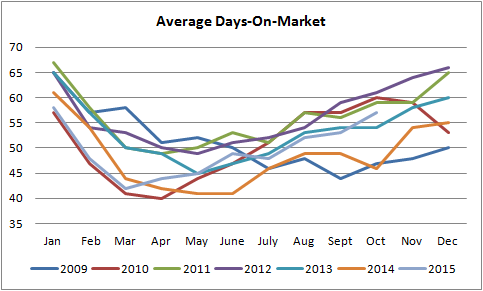
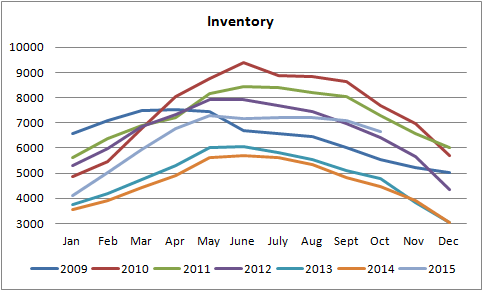
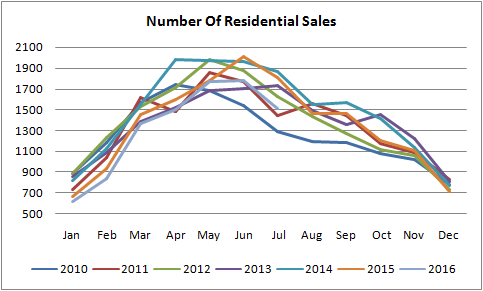
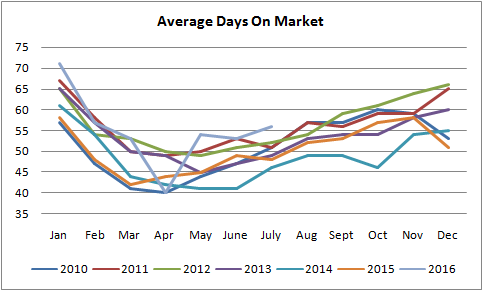
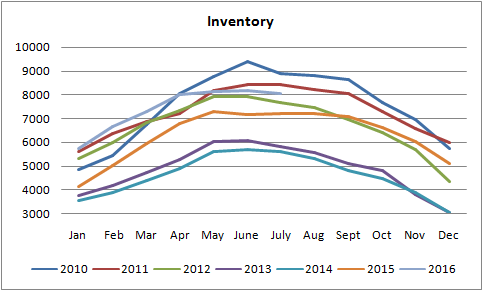
Total of 1,515 residential properties have sold in the 7nd month of 2016, 15% less than in June and 16% less than in same period last year. The inventory decreased to 8,048 residential properties available compared to 8,179 last months and 7,226 in July of 2015. Average Days-On-Market were up by 3 day at 56.

All the information in this article has been provided by Realtors® Association of Edmonton!

graph for single detached home prices for sold homes in edmonton from january of 2010 to july of 2016

graph for condo prices sold in edmonton from january of 2010 to july of 2016

number of sales grapf for residential properties sold in edmonton from january of 2010 to july of 2016

average days on market graph for homes for sale in edmonton from january of 2010 to july of 2016

graph for residential properties avalaible for sale from january of 2010 to july of 2016

Brought to you by: Edmonton homes for sale blog

1,232 Views, 0 Comments

The average price for a single family detached home in June of 2016 was $435,366, down by 1.2% from last month and down by 1.9% from June of 2015. The condo prices were up by 3.5% at 263,366 from $254,555.

Total of 1,785 residential properties have sold in the 6nd month of 2016, 0.8% more than in May and 11% less than in same period last year. The inventory increased to 8,179 residential properties available compared to 8,153 last months and 7,177 in June of 2015. Average Days-On-Market were down by 1 day at 53.

All the information in this article has been provided by Realtors® Association of Edmonton!

average selling price for single detached houses in Edmonton graph from jan of 2010 to July of 2016

average selling price for condos in Edmonton grap

graph for edmonton residential properties that have sold from jan of 2010 to July of 2016

dyas on the market graph for homes sold in edmonton from jan of 2010 to july of 2016

inventory graph for homes for sale in edmonton from january of 2010 to july of 2016

Brought to you by Edmonton homes for sale blog!

2,663 Views, 0 Comments

The average price for a single family detached home in May of 2016 was $440,573, almost identical as last month and down by 1% from May of 2015. The condo prices were up by 1.4% at 254,555 from $250,869.

Total of 1,771 residential properties have sold in the 5nd month of 2016, 18% more than in April and 1% less than in same period last year. The inventory increased to 8,153 residential properties available compared to 8,033 last months and 7,303 in May of 2015. Average Days-On-Market were up by 14 days at 54.

All the information in this article has been provided by Realtors® Association of Edmonton!

graph for prices of single detached homes sold in edmonton between january of 2010 to may of 2016

graph for prices ofgraph for  condos sold in edmonton between january of 2010 to may of 2016

graph for number of residential properties sold in edmonton between january of 2010 to may of 2016

graph for average days on the market for homes sold in edmonton between january of 2010 to may of 2016

graph for inventory of homes for sale in edmonton between january of 2010 to may of 2016

Brought to you by Edmonton homes for sale blog!

1,546 Views, 0 Comments

The average price for a single family detached home in April of 2016 was $439,982, almost identical as last month and down by 0.3% from April of 2015. The condo prices were down by 1% at 250,869 from $251,093.

Total of 1,498 residential properties have sold in the 4nd month of 2016, 6% less than same period last year. The inventory increased to 8,033 residential properties available compared to 7,294 last months and 6,784 in April of 2015. Average Days-On-Market were down by 7 days at 40.

All the information in this article has been provided by Realtors® Association of Edmonton! Edmonton Housing Prices Unchanged, While Inventory On The Rise!

graph for average selling price for houses in edmonton from january of 2010 to april of 2016

graph for average selling price for condos in edmonton from january of 2010 to april of 2016

graph for number of residential sales in edmonton from january of 2010 to april of 2016

graph for average days on the market for homes sold in edmonton from january of 2010 to april of 2016

inventory grap for homes for sale in edmonton from january of 2010 to april of 2016

Bought to you by Edmonton homes for sale blog!

1,342 Views, 0 Comments

The average price for a single family detached home in March of 2016 was $439,815, up by 4.73% from last month and up by 0.56% from March of 2015. The condo prices were also up by 1.6% at 251,093 from $247,090.

Total of 1,364 residential properties have sold in the 3nd month of 2016, 6.13% less than same period last year. The inventory increased to 7,294 residential properties available compared to 6,681 last months and 5,944 in March of 2015. Average Days-On-Market were down by 4 day at 53.

All the information in this article has been provided by Realtors® Association of Edmonton!

graph for single detached homes sold in Edmonton between march of 2016 and january of 2010

graph forgraph for condos sold in Edmonton between march of 2016 and january of 2010

graph for number of residential sales of homes sold in Edmonton between march of 2016 and january of 2010

graph for days on market for homes sold in Edmonton between march of 2016 and january of 2010

inventory graph for homes for sale in Edmonton between march of 2016 and january of 2010

Brought to you by Edmonton Homes For Sale Blog!

1,089 Views, 0 Comments

The average price for a single family detached home in February of 2016 was $419,940, almost unchanged from last month and down by 2.7% from February of 2015. The condo prices were up by 8.8% at 247,090 from $227,052.

Total of 837 residential properties have sold in the 2nd month of 2016, 10.1% less than same period last year. The inventory increased to 6,681 residential properties available compared to 5,751 last months and 5,008 in February of 2015. Average Days-On-Market were down by 14 day at 57.

All the information in this article has been provided by Realtors® Association of Edmonton!

average selling prices for houses sold in edmonton graph from 2010 to 2016

average selling prices for condos sold in edmonton graph from 2010 to 2016

sales graph for homes sold in edmonton from 2010 to 2016

inventory grapg for homes sold in edmonton from 2010 to 2016

Brought to you by: Edmonton homes for sale blog!

1,402 Views, 0 Comments

The average price for a single family detached home in January of 2016 was $418,928, down by 1.3 percent from last month and down by 1.2% from January of 2015. The condo prices were also down by staggering 10.3% at $227,052 from $252,954.

Total of 618 residential properties have sold in the 1st month of 2016, 7.2% less than same period last year. The inventory increased to 5,751 residential properties available compared to 5,088 last months and 4,132 in January of 2015. Average Days-On-Market were up by 9 day at 71.

All the information in this article has been provided by Realtors® Association of Edmonton!

average selling prices graph of homes sold in edmonton from january of 2010 to january of 2016

average selling prices graph of condos sold in edmonton from january of 2010 to january of 2016

number of homes sold in edmonton graph from january of 2010 to january of 2016

days on the market graph of homes being sold in edmonton from january of 2010 to january of 2016

inventory graph for homes for sale in edmonton from january of 2010 to january of 2016

Brought to you by: Edmonton Homes For Sale Blog!

2,288 Views, 0 Comments

The average price for a single family detached home in December of 2015 was $437,569, up by 1.0 percent from last month and up by 1.8% from December of 2014. The condo prices were also up by 0.4% at $252,954 from $253,454.

Total of 713 residential properties have sold in the 12th month of 2015, 7.4% less than same period last year. The inventory decreased to 5,088 residential properties available compared to 6,043 last months and 3,059 in December of 2014. Average Days-On-Market were down by 7 day at 51.

All the information in this article has been provided by Realtors® Association of Edmonton!

graph for single detached homes sold in edmonton from january of 2010 to december of 2015

graph for single degraph for condos sold in edmonton from january of 2010 to december of 2015

gragraph for number of residential properties sold in edmonton from january of 2010 to december of 2015

ggraph for residential inventory of homes for sale from january of 2010 to december of 2015

Brought to you by Edmonton Homes For Sale Blog!

1,301 Views, 0 Comments

The average price for a single family detached home in November of 2015 was $432,862, down by 1.4 percent from last month and down by 2.6% from November of 2014. On the other hand, the condo prices were up by 3.8% at $253,454 from $244,225.

Total of 1,104 residential properties have sold in the 11th month of 2015, 2.9% less than same period last year. The inventory decreased to 6,043 residential properties available compared to 6,641 last months and 3,906 in November of 2014. Average Days-On-Market were up by 1 day at 58.

All the information in this article has been provided by Realtors® Association of Edmonton!

Brought to you by: Edmonton Homes For Sale Blog!

1,579 Views, 0 Comments

The average price for a single family detached home in October of 2015 was $438,935, up by 1.57 percent from last month (bolstered by the sale of two homes well over the $3.5 million mark), and up by 2.75% from October of 2014. The condo prices were also down by 3.45% at $244,225 from $252,953.

Total of 1,199 residential properties have sold in the 10th month of 2015, 15% less than same period last year. The inventory decreased to 6,641 residential properties available compared to 7,108 last months and 4,473 in October of 2014.

Average Days-On-Market were up by 4 day at 57.

All the information in this article has been provided by Realtors® Association of Edmonton!

Brought to you by Edmonton homes for sale Blog!

1,514 Views, 0 Comments

Sign up for email updates