Tagged : edmonton real estate stats

Found 4 blog entries tagged as "edmonton real estate stats".

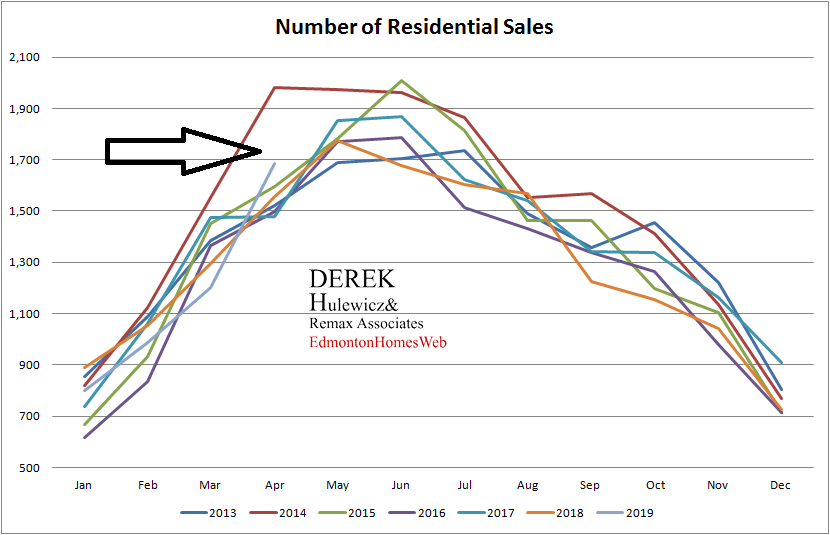
Edmonton, October 4, 2021: Total residential unit sales in the Greater Edmonton Area (GEA) real estate market for September 2021 increased 0.9% compared to September 2020 and decreased 8.4% from August 2021.

New residential listings are up year-over-year, increasing 4.9% from September 2020. However, new residential listings are down month-over-month, decreasing 1.7% from August 2021. Overall inventory in the GEA was down 2.3% from September of last year and decreased 4.1% from August 2021.

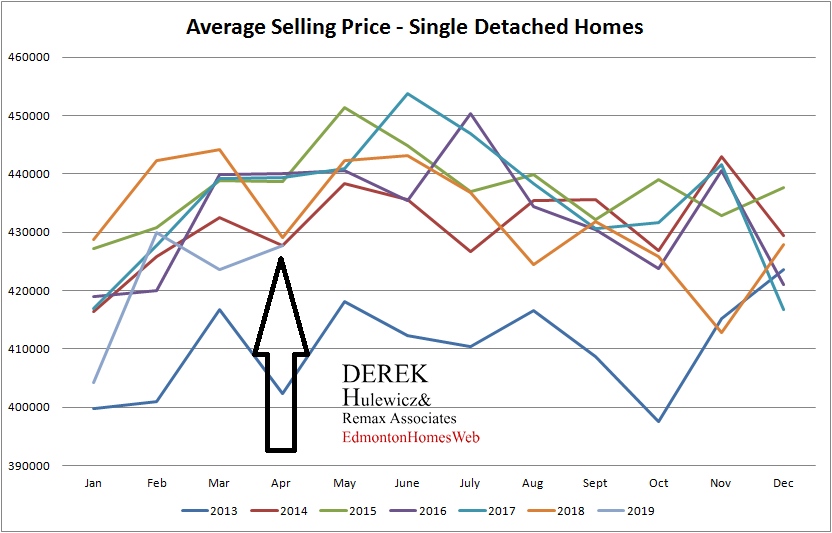
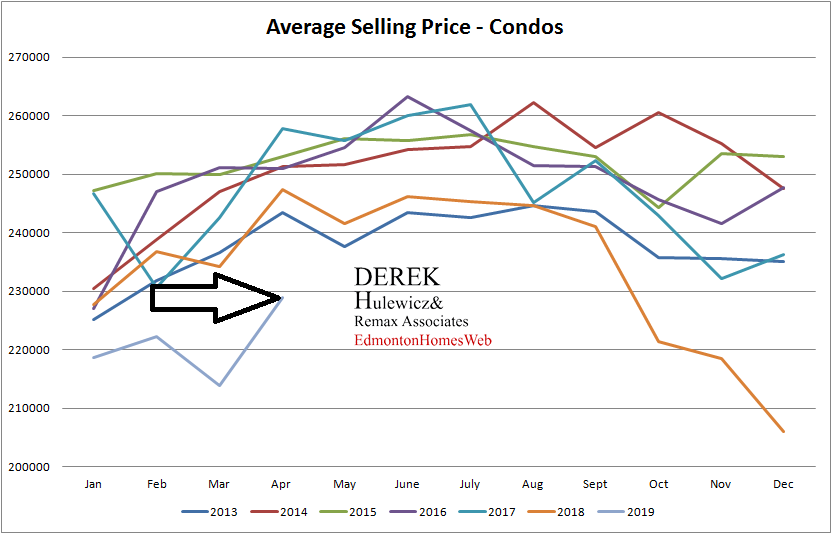
For September, single-family home unit sales are down 2.8% from September 2020 and down 7.6% from August 2021 at 1,151. Condo unit sales increased 16.8% from September 2020 and decreased 7.0% from August 2021. Duplex/rowhouse unit sales were down 11.4%
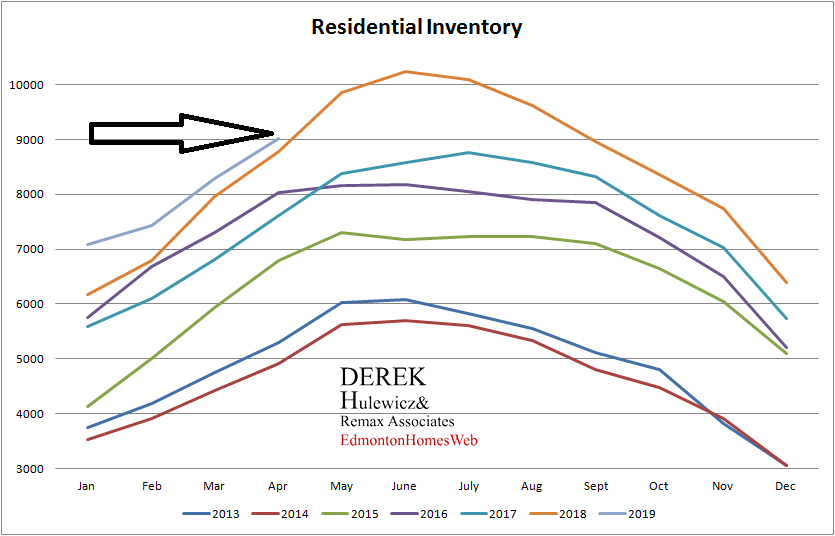
4,943 Views, 0 Comments

edmonton real estate market report for april 2020 by derek hulewiczEdmonton real estate market was up slightly in April of 2020, while number of residential sales were down substantially due to the Covid 19 pandemic!

The average price for a single family detached home in April of 2020 was $410,200 up by 1.45% from last month and down by 2.80% from April of 2019. Condo prices were also up by 2.47% at $224,022 from $218,613 last month.

Total of 750 residential properties have sold in the 4th month of 2020, 35.68% less than in March and 55% less than in same period last year, which is due to the Covid 19 pandemic.

The inventory decreased to 7,237 residential properties available compared to 7,346 last month and 9,015 in April of 2019.

It took on average 64 days for all these residential properties to sell, 4

1,003 Views, 1 Comment

The average price for a single family detached home in April of 2019 was $427,657 up by 1.17% from last month and down by 1.38% from April of 2018. The condo prices were also up by 7.05% at $228,933 from $213,856 last month.

Total of 1,684 residential properties have sold in the 4th month of 2019, 40.33% more than in March and 1.63% more than in same period last year. The inventory increased to 9,015 residential properties available compared to 8,287 last months and 8,788 in April of 2018. Average Days-On-Market were down from last month by 4 days at 60.

All the information in this article has been provided by Realtors® Association of Edmonton!

real estate statistics for average selling prices for homes sold in Edmonton from January of 2012 to April of 2019

real estate statistics for average selling prices for condominiums sold in Edmonton from January of 2012 to April of 2019

real estate statistics for average number of properties sold in Edmonton from January of 2012 to April of 2019

real estate statistics for average days on market of homes sold in edmonton from January of 2012 to April of 2019

real estate statistics for residential inventory of homes for sale in Edmonton from January of 2012 to April of 2019

915 Views, 1 Comment

Edmonton's single detached house prices, number of sales, inventory, and average "days-on-market" are down in October of 2014, while condo prices are up!

The average price for a single family detached home in October was $426,848 down by 2% from last month, and up by 6.8% from October of 2013. The condo prices were up by 2.3% at $260,491. Total of 1,412 residential properties have sold in the 10nd month of 2014, 2.9% less than same period last year, and it took on average 46 days for these properties to sale. The inventory decreased to 4,473 residential properties available compared to 4,812 last months and 4,807 in October of 2013.

All the information in this article has been provided by Realtors® Association of Edmonton!

Below you will find five

1,946 Views, 0 Comments

Sign up for email updates